Gene Information
|
Gene Name
|
LCT |
|
Gene ID
|
3938
|
|
Gene Full Name
|
lactase |
|
Gene Alias
|
LAC|LPH|LPH1 |
|
Transcripts
|
ENSG00000115850
|
|
Virus
|
HTLV1 |
|
Gene Type
|
protein-coding |
|
HPA Location Info
|

|
|
Membrane Info
|
Disease related genes, Enzymes, Human disease related genes, Metabolic proteins, Plasma proteins, Potential drug targets, Predicted membrane proteins |
|
Uniport_ID
|
P09848
|
|
HGNC ID
|
HGNC:6530
|
|
OMIM ID
|
603202 |
|
Summary
|
The protein encoded by this gene belongs to the glycosyl hydrolase 1 family of proteins. The encoded preproprotein is proteolytically processed to generate the mature enzyme. This enzyme is integral to the plasma membrane and has both phlorizin hydrolase activity and lactase activity. Mutations in this gene are associated with congenital lactase deficiency. Polymorphisms in this gene are associated with lactase persistence, in which intestinal lactase activity persists at childhood levels into adulthood. [provided by RefSeq, Jan 2016] |
Target gene [LCT] related to VISs 
Integration Table: if previous studies reported that target gene was altered by virus integration events, the overlap between VISs in this literature and Cistrome factors was listed in this section
| DVID |
Chromosome |
HM |
TFBS |
CA |
Sum of Overlapped Records |
Detail |
| 6023115 |
chr2 |
3 |
1 |
0 |
4 |
View |
Target gene [LCT] related to Omics data
| Data ID |
Experiment type |
Sample number |
Platform |
|
C GSE94732
|
Chip-seq |
24 |
Illumina NextSeq 500 (Homo sapiens);illumina Genome Analyzer IIx (Homo sapiens) |
|
GSE168557
|
Expression array |
6 |
Agilent-039494 SurePrint G3 Human GE v2 8x60K Microarray 039381 (Feature Number version) |
|
GSE52244
|
Expression array |
15 |
[HuEx-1_0-st] Affymetrix Human Exon 1.0 ST Array [probe set (exon) version] |
|
GSE10789
|
Expression array |
6 |
NCI/ATC Hs-OperonV3 |
|
GSE189602
|
Methylation profiling (Array) |
4 |
Infinium MethylationEPIC |
|
GSE136189
|
Methylation profiling (Array) |
40 |
Illumina HumanMethylation450 BeadChip (HumanMethylation450_15017482);Illumina Infinium HumanMethylation850 BeadChip |
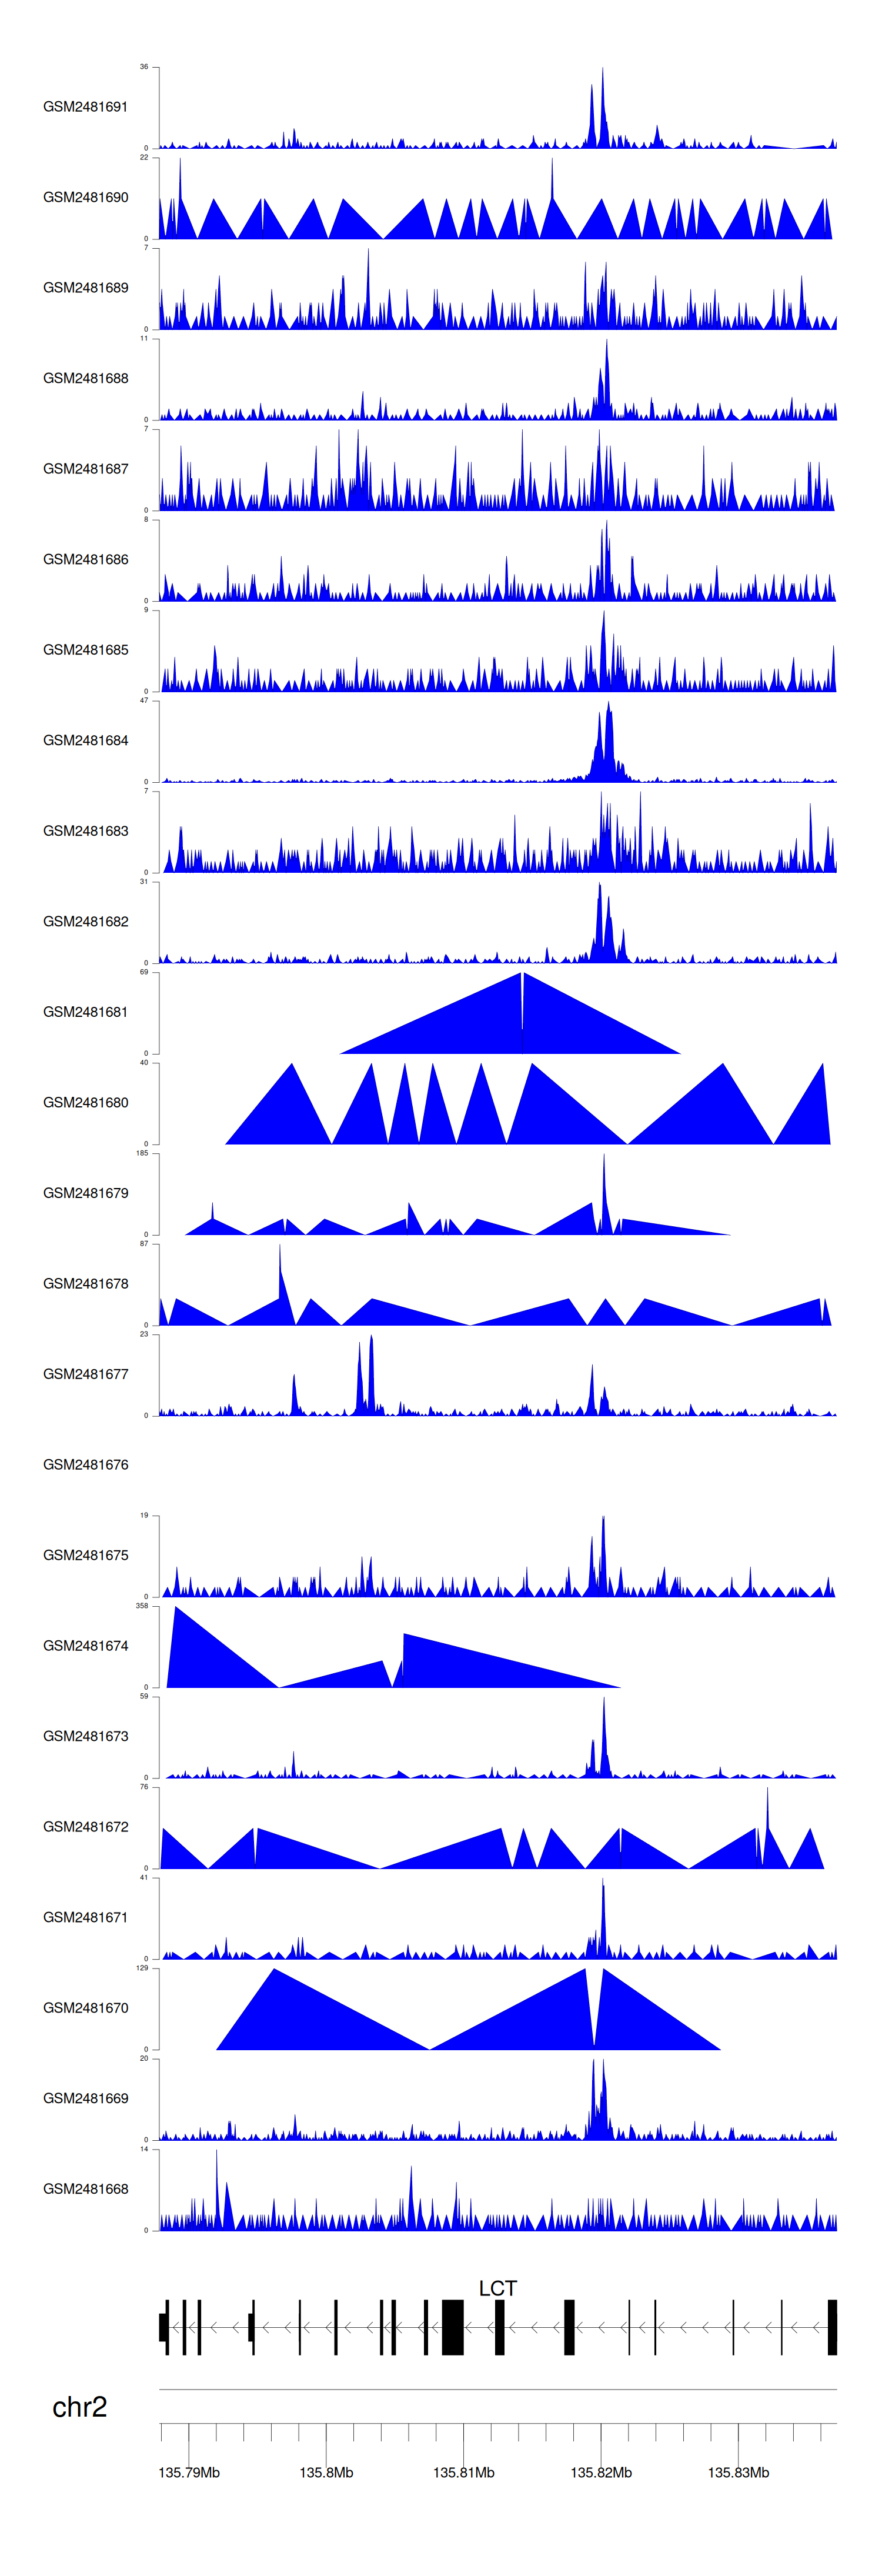
When the gene can detect a peak in the dataset, a peak plot will be displayed.
> Dataset: GSE94732 - LCT peak across samples
|
Peak Plot
|
|
|
