Gene Information
|
Gene Name
|
LDLRAD4 |
|
Gene ID
|
753
|
|
Gene Full Name
|
low density lipoprotein receptor class A domain containing 4 |
|
Gene Alias
|
C18orf1 |
|
Transcripts
|
ENSG00000168675
|
|
Virus
|
HTLV1 |
|
Gene Type
|
protein-coding |
|
HPA Location Info
|
Vesicles; 
|
|
Membrane Info
|
Predicted intracellular proteins, Predicted membrane proteins |
|
Uniport_ID
|
O15165
|
|
HGNC ID
|
HGNC:1224
|
|
OMIM ID
|
606571 |
|
Summary
|
Enables R-SMAD binding activity. Involved in negative regulation of cell migration; negative regulation of epithelial to mesenchymal transition; and negative regulation of transmembrane receptor protein serine/threonine kinase signaling pathway. Located in early endosome membrane. [provided by Alliance of Genome Resources, Apr 2025] |
Target gene [LDLRAD4] related to VISs 
Integration Table: if previous studies reported that target gene was altered by virus integration events, the overlap between VISs in this literature and Cistrome factors was listed in this section
Target gene [LDLRAD4] related to Omics data
| Data ID |
Experiment type |
Sample number |
Platform |
|
GSE52244
|
Expression array |
15 |
[HuEx-1_0-st] Affymetrix Human Exon 1.0 ST Array [probe set (exon) version] |
|
GSE224047
|
RNA-seq |
10 |
Illumina NextSeq 500 (Homo sapiens) |
|
GSE189602
|
Methylation profiling (Array) |
4 |
Infinium MethylationEPIC |
|
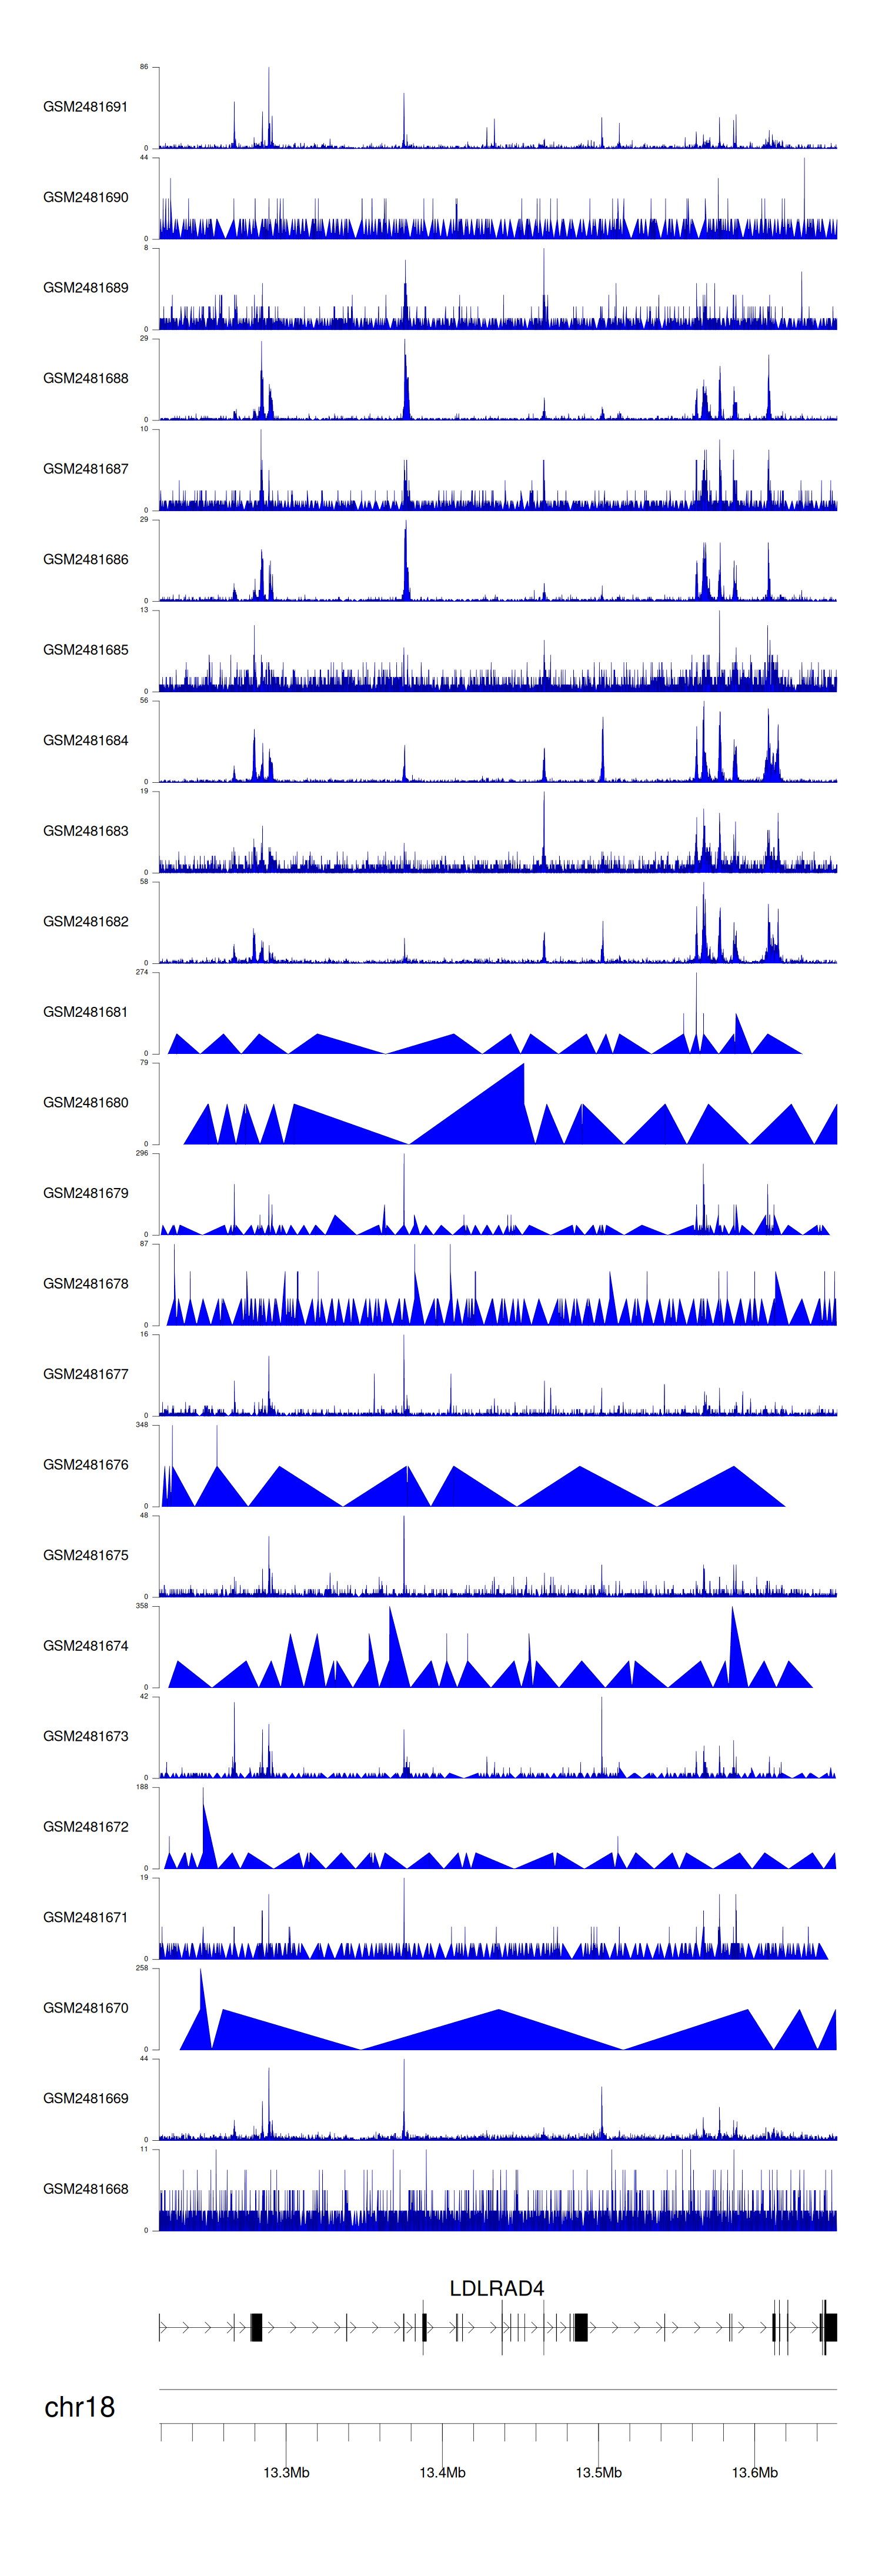
C GSE94732
|
Chip-seq |
24 |
Illumina NextSeq 500 (Homo sapiens);illumina Genome Analyzer IIx (Homo sapiens) |
When the gene can detect a peak in the dataset, a peak plot will be displayed.
> Dataset: GSE94732 - LDLRAD4 peak across samples
|
Peak Plot
|
|
|
