Gene Information
|
Gene Name
|
LIPE |
|
Gene ID
|
3991
|
|
Gene Full Name
|
lipase E, hormone sensitive type |
|
Gene Alias
|
AOMS4|FPLD6|HSL|LHS|REH |
|
Transcripts
|
ENSG00000079435
|
|
Virus
|
HTLV1 |
|
Gene Type
|
protein-coding |
|
HPA Location Info
|
Cytosol; 
|
|
Membrane Info
|
Disease related genes, Enzymes, Human disease related genes, Metabolic proteins, Potential drug targets, Predicted intracellular proteins |
|
Uniport_ID
|
Q05469
|
|
HGNC ID
|
HGNC:6621
|
|
OMIM ID
|
151750 |
|
Summary
|
The protein encoded by this gene has a long and a short form, generated by use of alternative translational start codons. The long form is expressed in steroidogenic tissues such as testis, where it converts cholesteryl esters to free cholesterol for steroid hormone production. The short form is expressed in adipose tissue, among others, where it hydrolyzes stored triglycerides to free fatty acids. [provided by RefSeq, Jul 2008] |
Target gene [LIPE] related to VISs 
Integration Table: if previous studies reported that target gene was altered by virus integration events, the overlap between VISs in this literature and Cistrome factors was listed in this section
| DVID |
Chromosome |
HM |
TFBS |
CA |
Sum of Overlapped Records |
Detail |
| 6008869 |
chr19 |
37 |
3 |
1 |
41 |
View |
Target gene [LIPE] related to Omics data
| Data ID |
Experiment type |
Sample number |
Platform |
|
C GSE94732
|
Chip-seq |
24 |
Illumina NextSeq 500 (Homo sapiens);illumina Genome Analyzer IIx (Homo sapiens) |
|
GSE168557
|
Expression array |
6 |
Agilent-039494 SurePrint G3 Human GE v2 8x60K Microarray 039381 (Feature Number version) |
|
GSE52244
|
Expression array |
15 |
[HuEx-1_0-st] Affymetrix Human Exon 1.0 ST Array [probe set (exon) version] |
|
GSE10789
|
Expression array |
6 |
NCI/ATC Hs-OperonV3 |
|
GSE189602
|
Methylation profiling (Array) |
4 |
Infinium MethylationEPIC |
|
GSE136189
|
Methylation profiling (Array) |
40 |
Illumina HumanMethylation450 BeadChip (HumanMethylation450_15017482);Illumina Infinium HumanMethylation850 BeadChip |
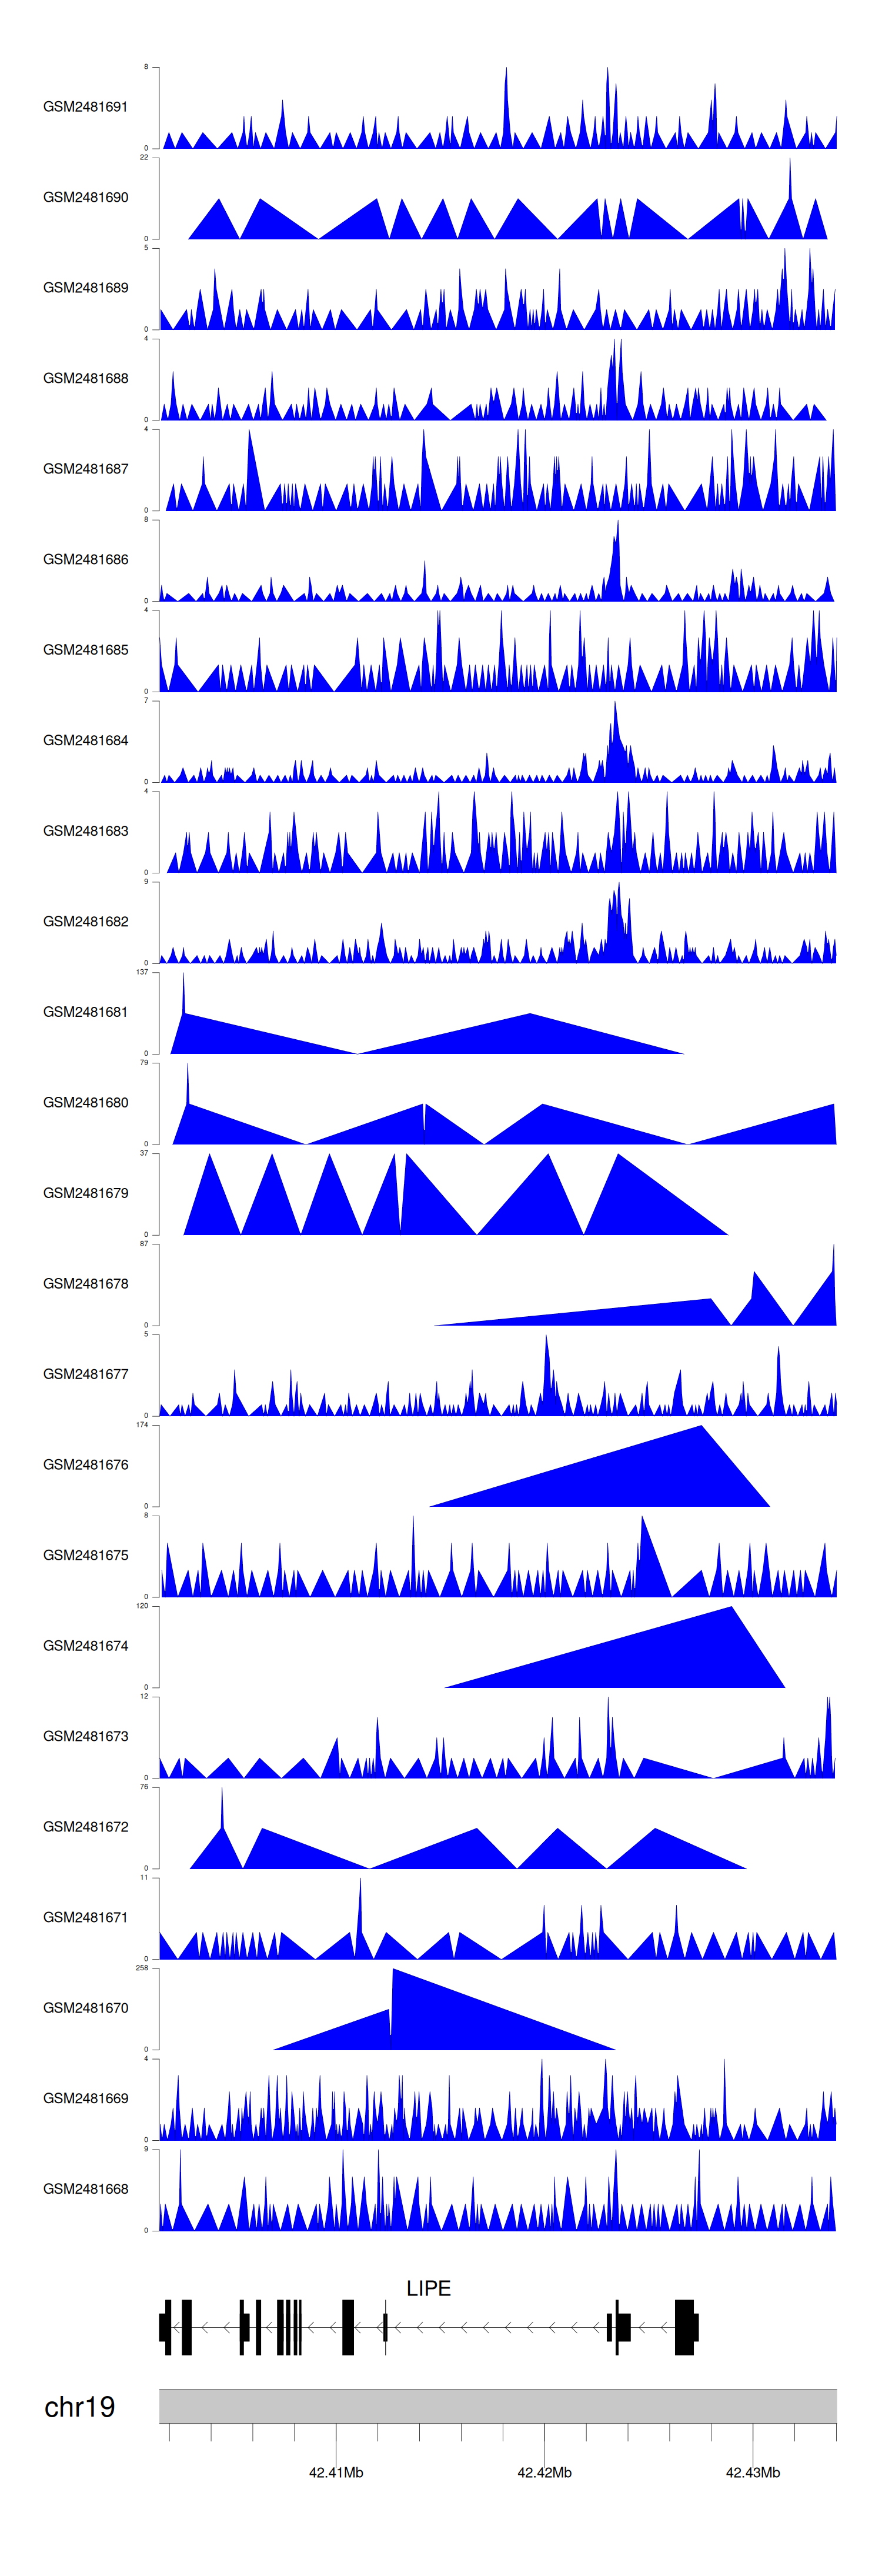
When the gene can detect a peak in the dataset, a peak plot will be displayed.
> Dataset: GSE94732 - LIPE peak across samples
|
Peak Plot
|
|
|
