Gene Information
|
Gene Name
|
LOC107987083 |
|
Gene ID
|
107987083
|
|
Gene Full Name
|
- |
|
Gene Alias
|
- |
|
Virus
|
HBV |
|
Gene Type
|
ncRNA |
Target gene [LOC107987083] related to VISs

Integration Table: if previous studies reported that target gene was altered by virus integration events, the overlap between VISs in this literature and Cistrome factors was listed in this section
| DVID |
Chromosome |
HM |
TFBS |
CA |
Sum of Overlapped Records |
Detail |
| 1006340 |
chr9 |
35 |
5 |
0 |
40 |
View |
| 1011596 |
chr9 |
3 |
5 |
0 |
8 |
View |
| 1012062 |
chr9 |
3 |
4 |
0 |
7 |
View |
Target gene [LOC107987083] related to Omics data
| Data ID |
Experiment type |
Sample number |
Platform |
|
C GSE35465
|
Chip-seq;RNA-seq |
6 |
Illumina HiSeq 2000 (Homo sapiens) |
|
C GSE68402
|
Chip-seq |
26 |
Illumina MiSeq (Homo sapiens);Illumina HiSeq 2500 (Homo sapiens) |
|
C GSE64877
|
Chip-seq |
2 |
Illumina Genome Analyzer (Homo sapiens) |
|
C GSE100400
|
Chip-seq;RNA-seq;4C_cccDNA |
31 |
Illumina NextSeq 500 (Homo sapiens);Illumina NextSeq 500 (Mus musculus) |
|
C GSE131257
|
ATAC-seq;RNA-seq |
19 |
Illumina HiSeq 2500 (Homo sapiens) |
|
C GSE270130
|
Chip-seq |
27 |
Illumina NovaSeq 6000 (Homo sapiens) |
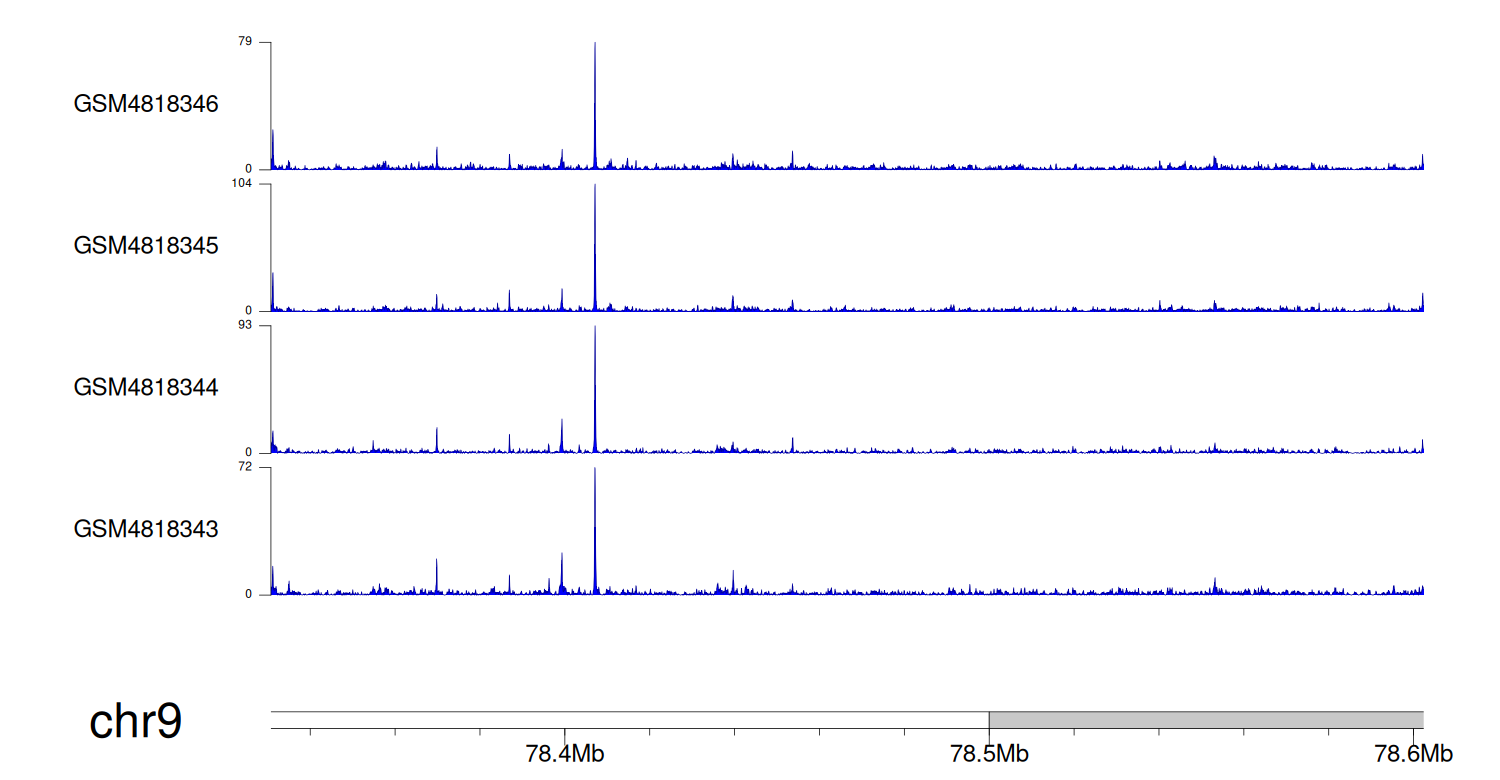
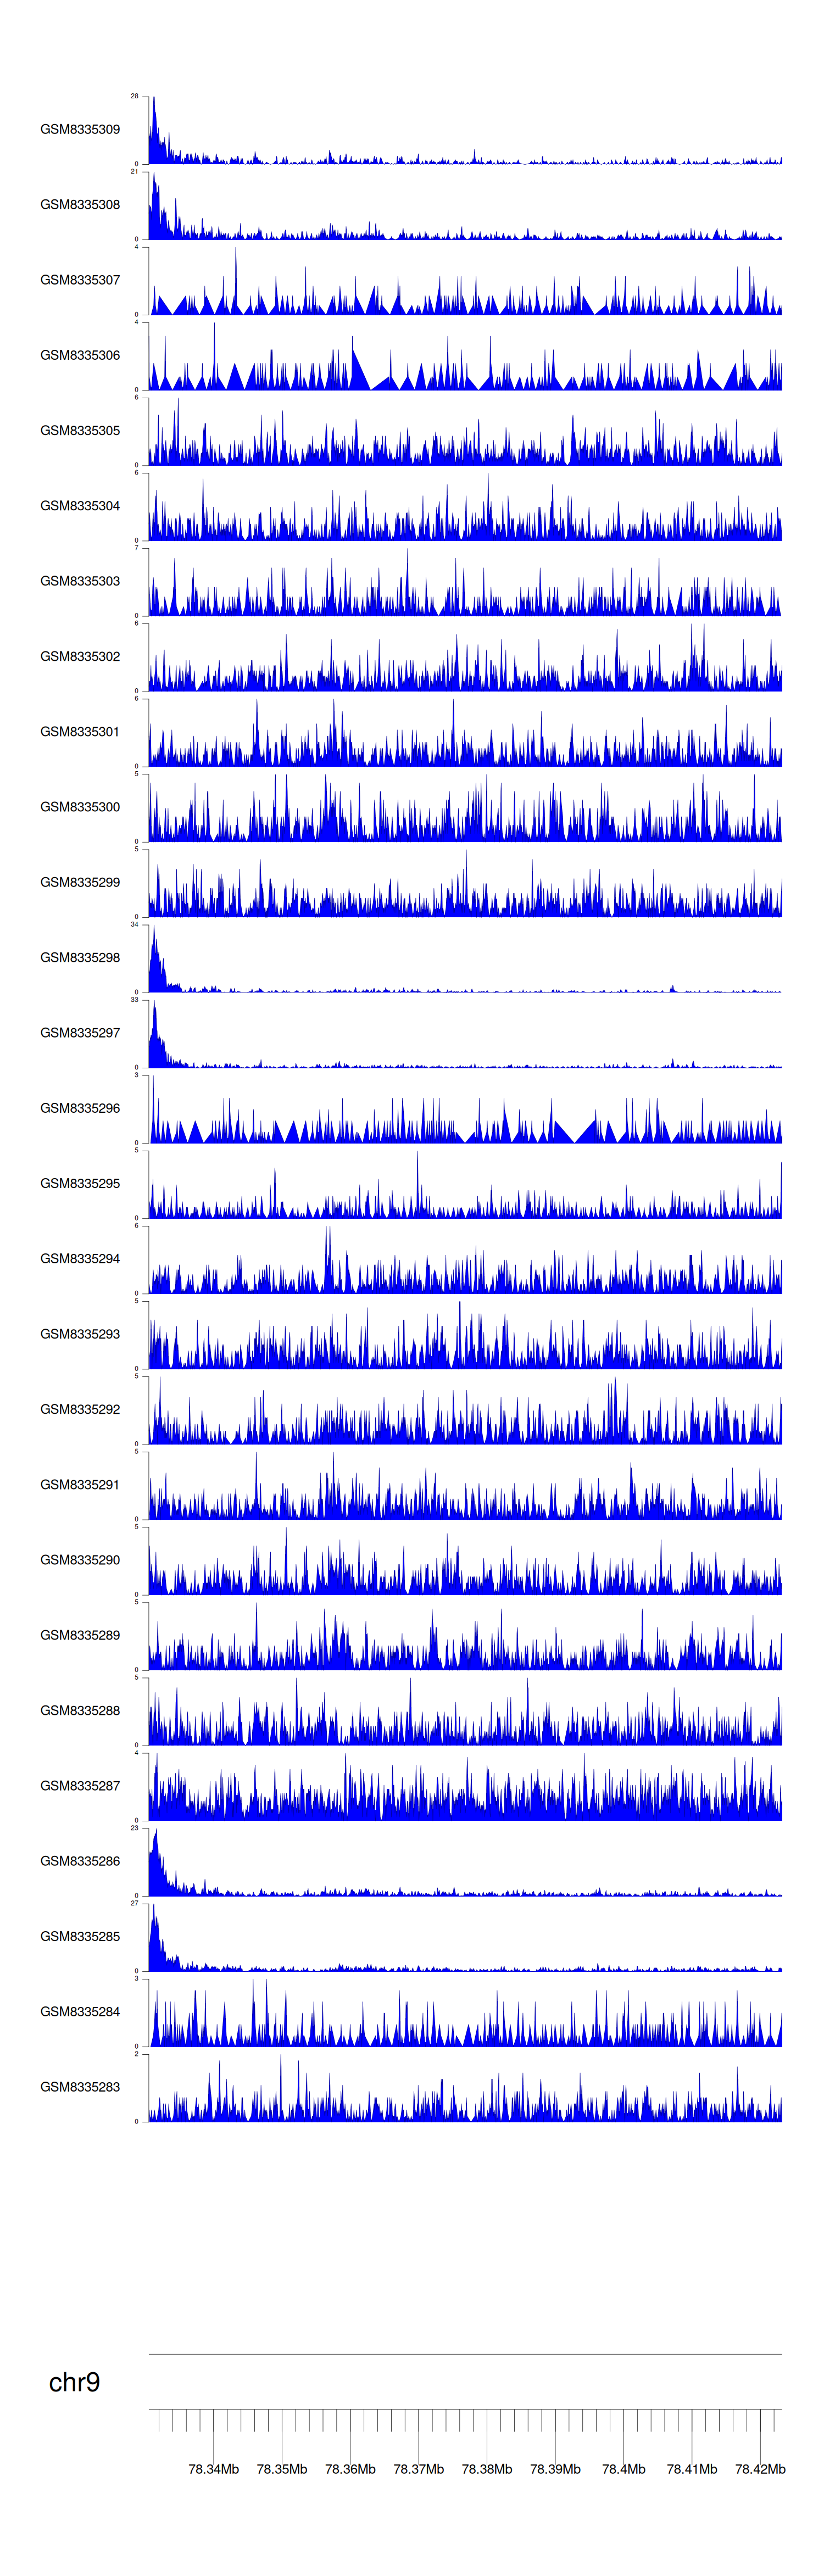
When the gene can detect a peak in the dataset, a peak plot will be displayed.
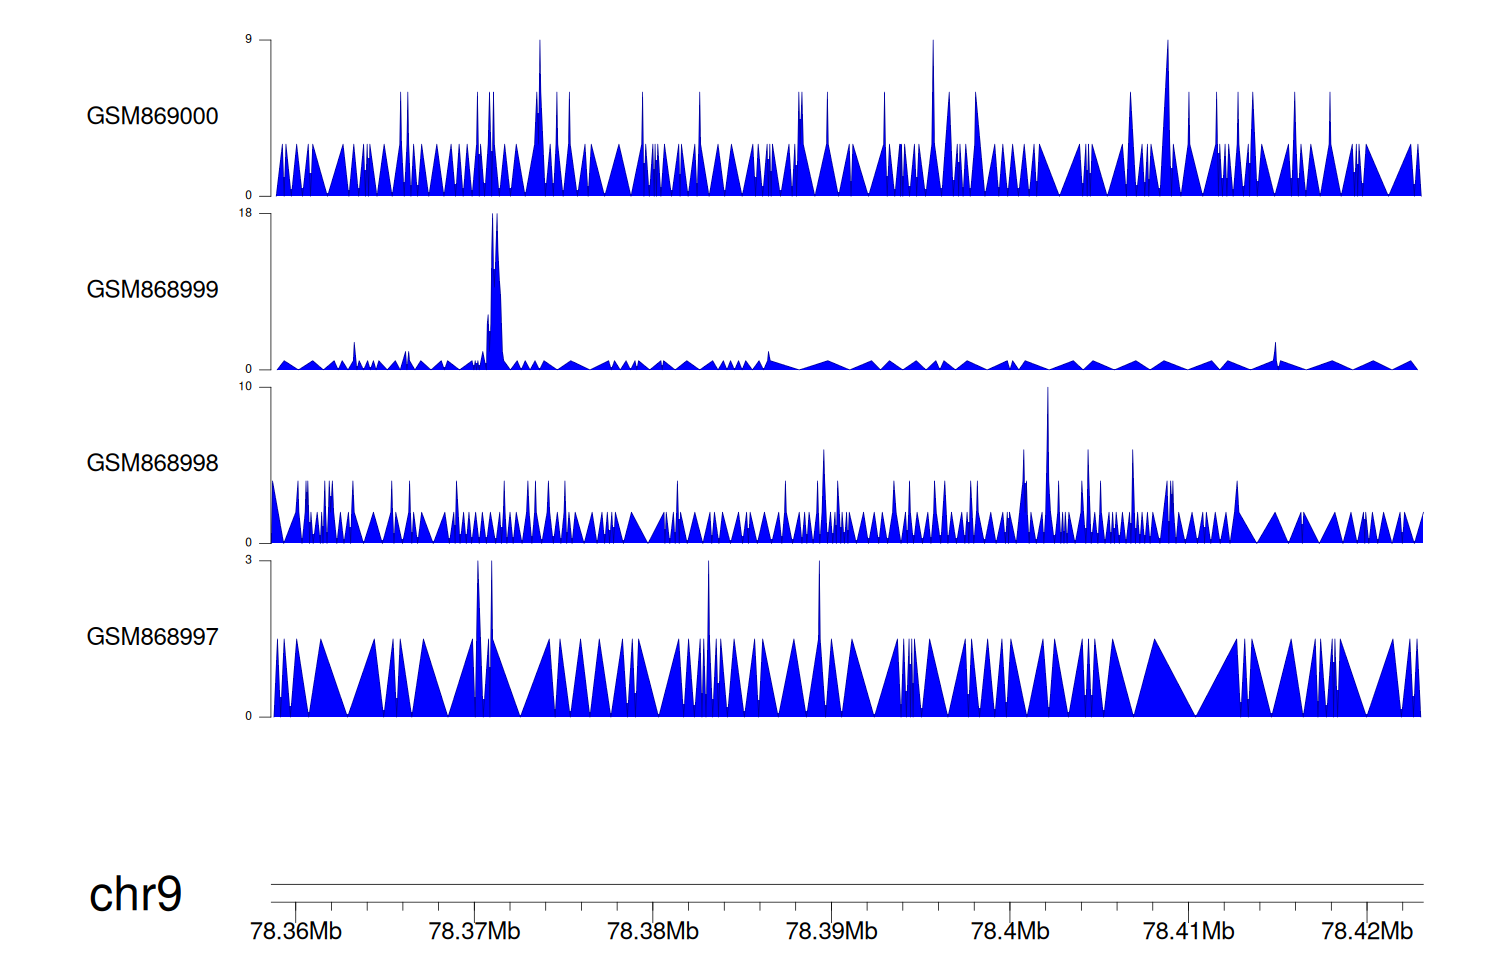
> Dataset: GSE35465 - LOC107987083 peak across samples
|
Peak Plot
|
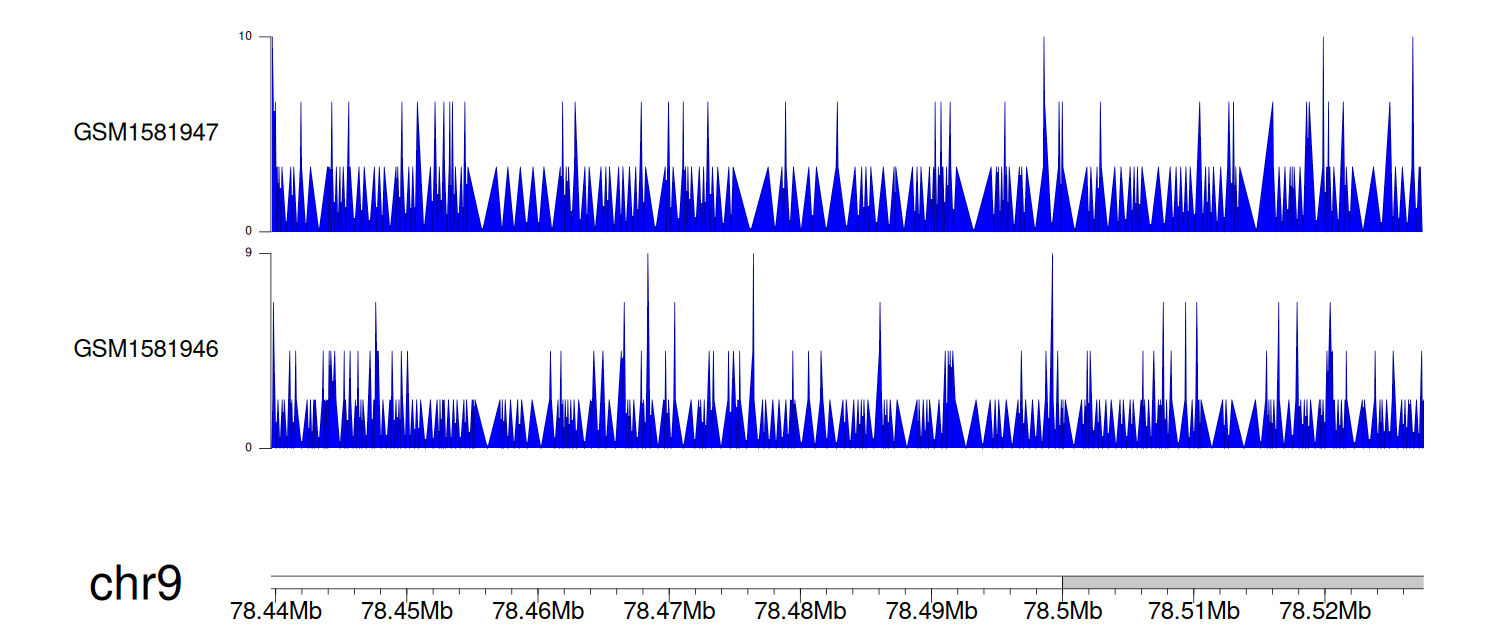
> Dataset: GSE68402 - LOC107987083 peak across samples
|
Peak Plot
|
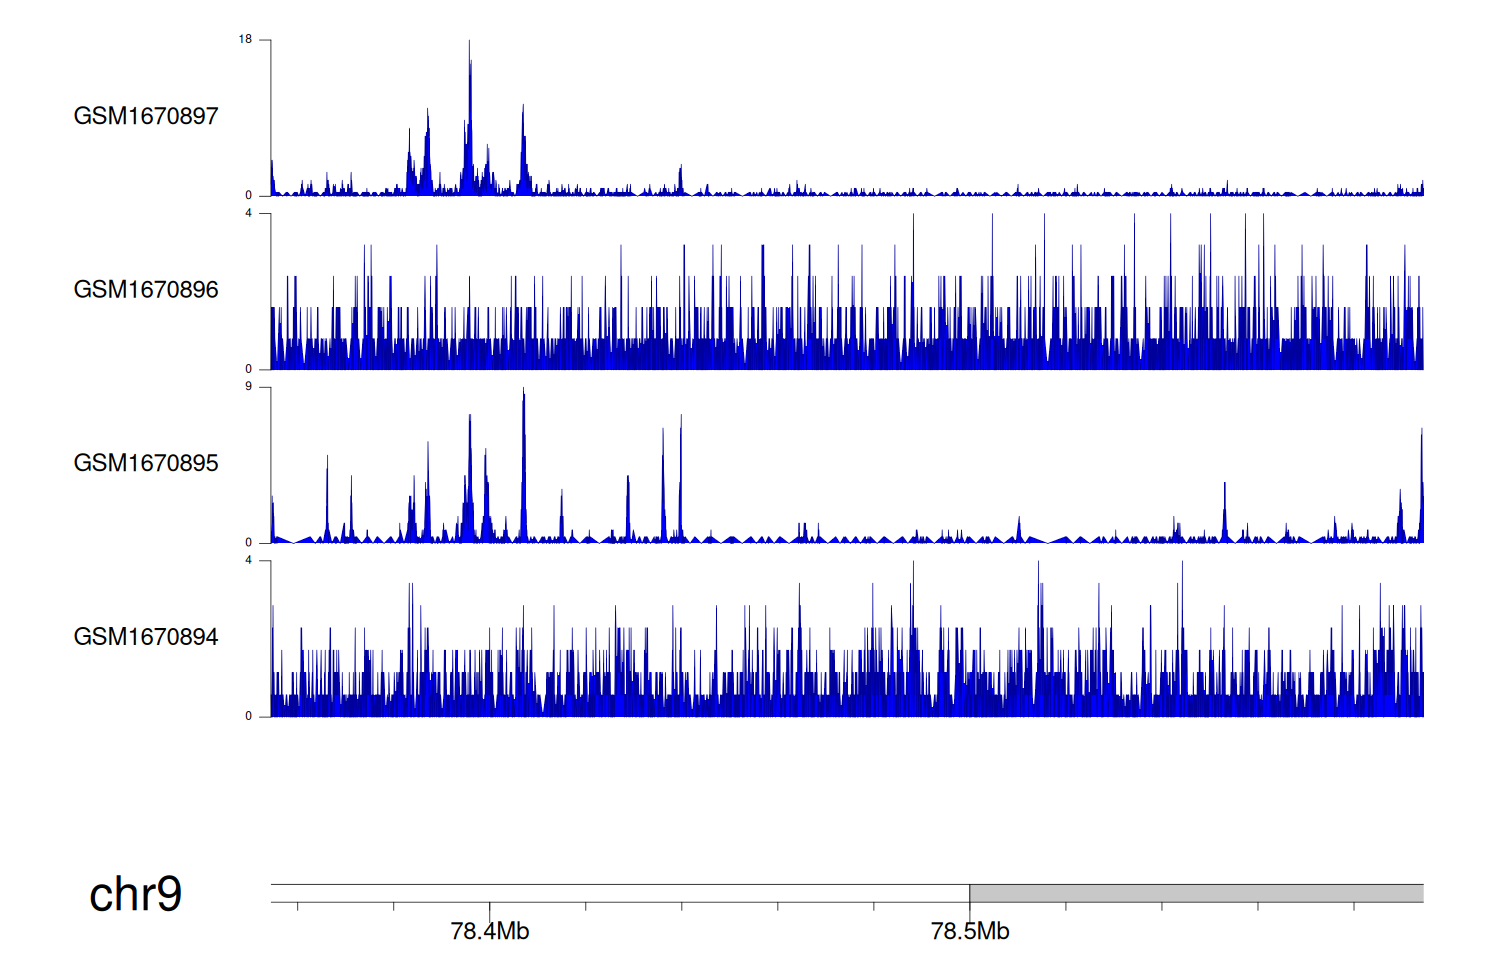
> Dataset: GSE64877 - LOC107987083 peak across samples
|
Peak Plot
|
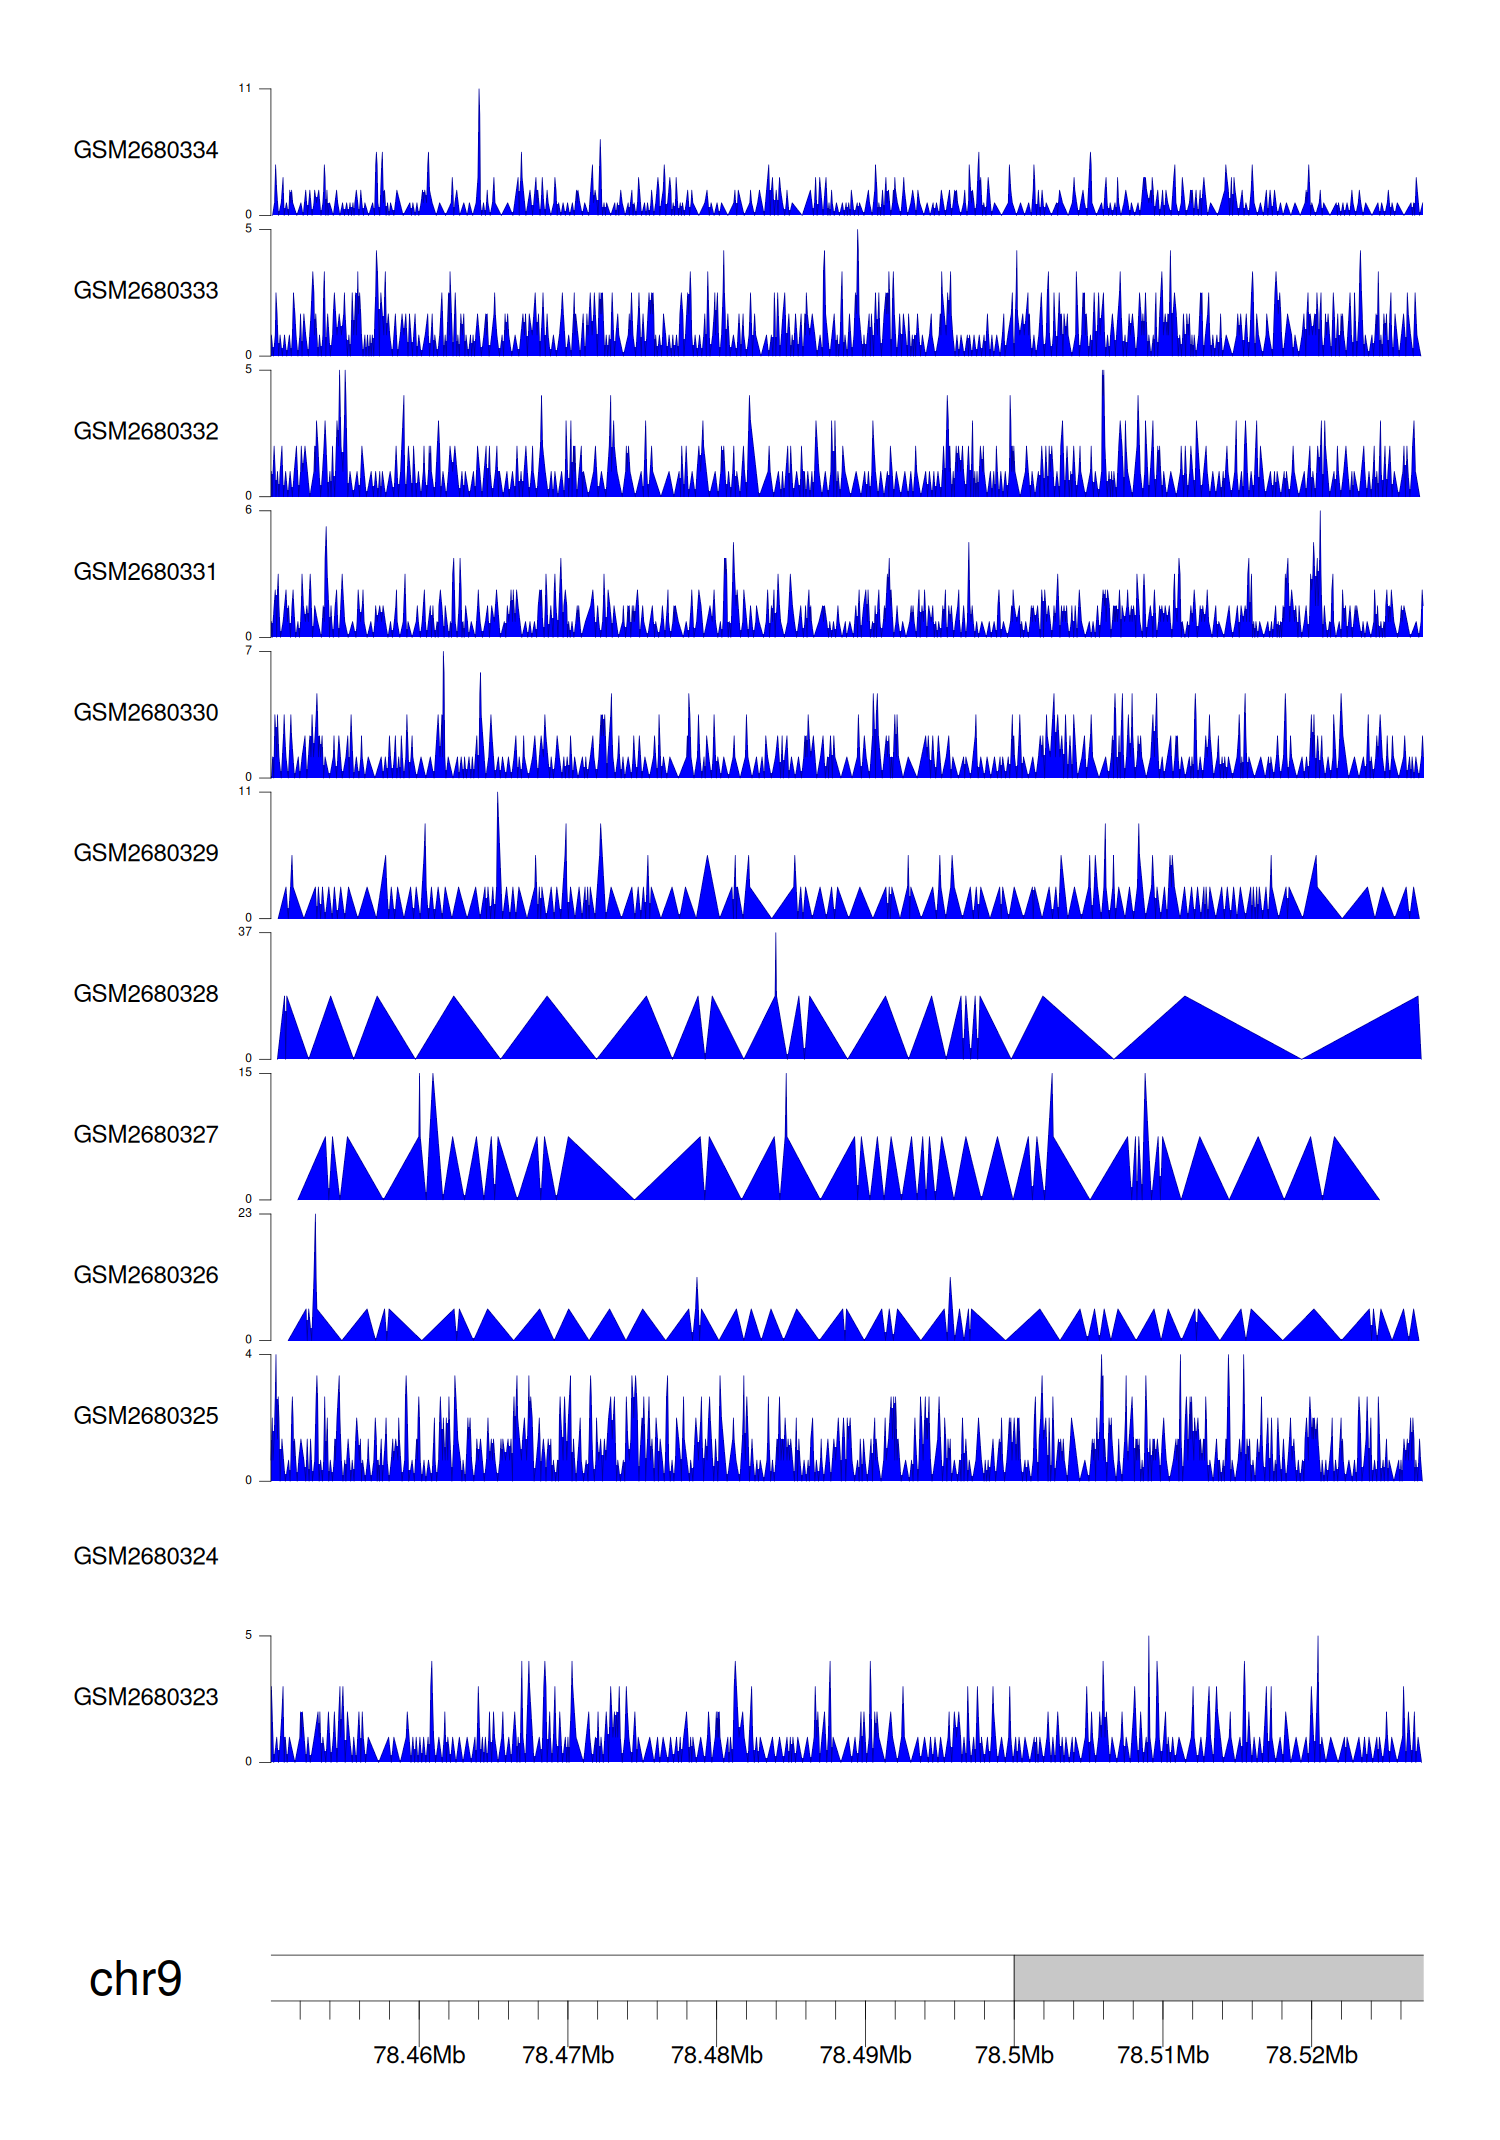
> Dataset: GSE100400 - LOC107987083 peak across samples
|
Peak Plot
|
> Dataset: GSE131257 - LOC107987083 peak across samples
|
Peak Plot
|
> Dataset: GSE270130 - LOC107987083 peak across samples
|
Peak Plot
|
