Gene Information
|
Gene Name
|
LPIN2 |
|
Gene ID
|
9663
|
|
Gene Full Name
|
lipin 2 |
|
Gene Alias
|
CRMO1|MJDS |
|
Transcripts
|
ENSG00000101577
|
|
Virus
|
HTLV1 |
|
Gene Type
|
protein-coding |
|
HPA Location Info
|
Cytosol;Plasma membrane, Actin filaments; 
|
|
Membrane Info
|
Disease related genes, Enzymes, Human disease related genes, Metabolic proteins, Plasma proteins, Potential drug targets, Predicted intracellular proteins |
|
Uniport_ID
|
Q92539
|
|
HGNC ID
|
HGNC:14450
|
|
OMIM ID
|
605519 |
|
Summary
|
Mouse studies suggest that this gene functions during normal adipose tissue development and may play a role in human triglyceride metabolism. This gene represents a candidate gene for human lipodystrophy, characterized by loss of body fat, fatty liver, hypertriglyceridemia, and insulin resistance. [provided by RefSeq, Jul 2008] |
Target gene [LPIN2] related to VISs 
Integration Table: if previous studies reported that target gene was altered by virus integration events, the overlap between VISs in this literature and Cistrome factors was listed in this section
| DVID |
Chromosome |
HM |
TFBS |
CA |
Sum of Overlapped Records |
Detail |
| 6001984 |
chr18 |
49 |
65 |
191 |
305 |
View |
Target gene [LPIN2] related to Omics data
| Data ID |
Experiment type |
Sample number |
Platform |
|
GSE189602
|
Methylation profiling (Array) |
4 |
Infinium MethylationEPIC |
|
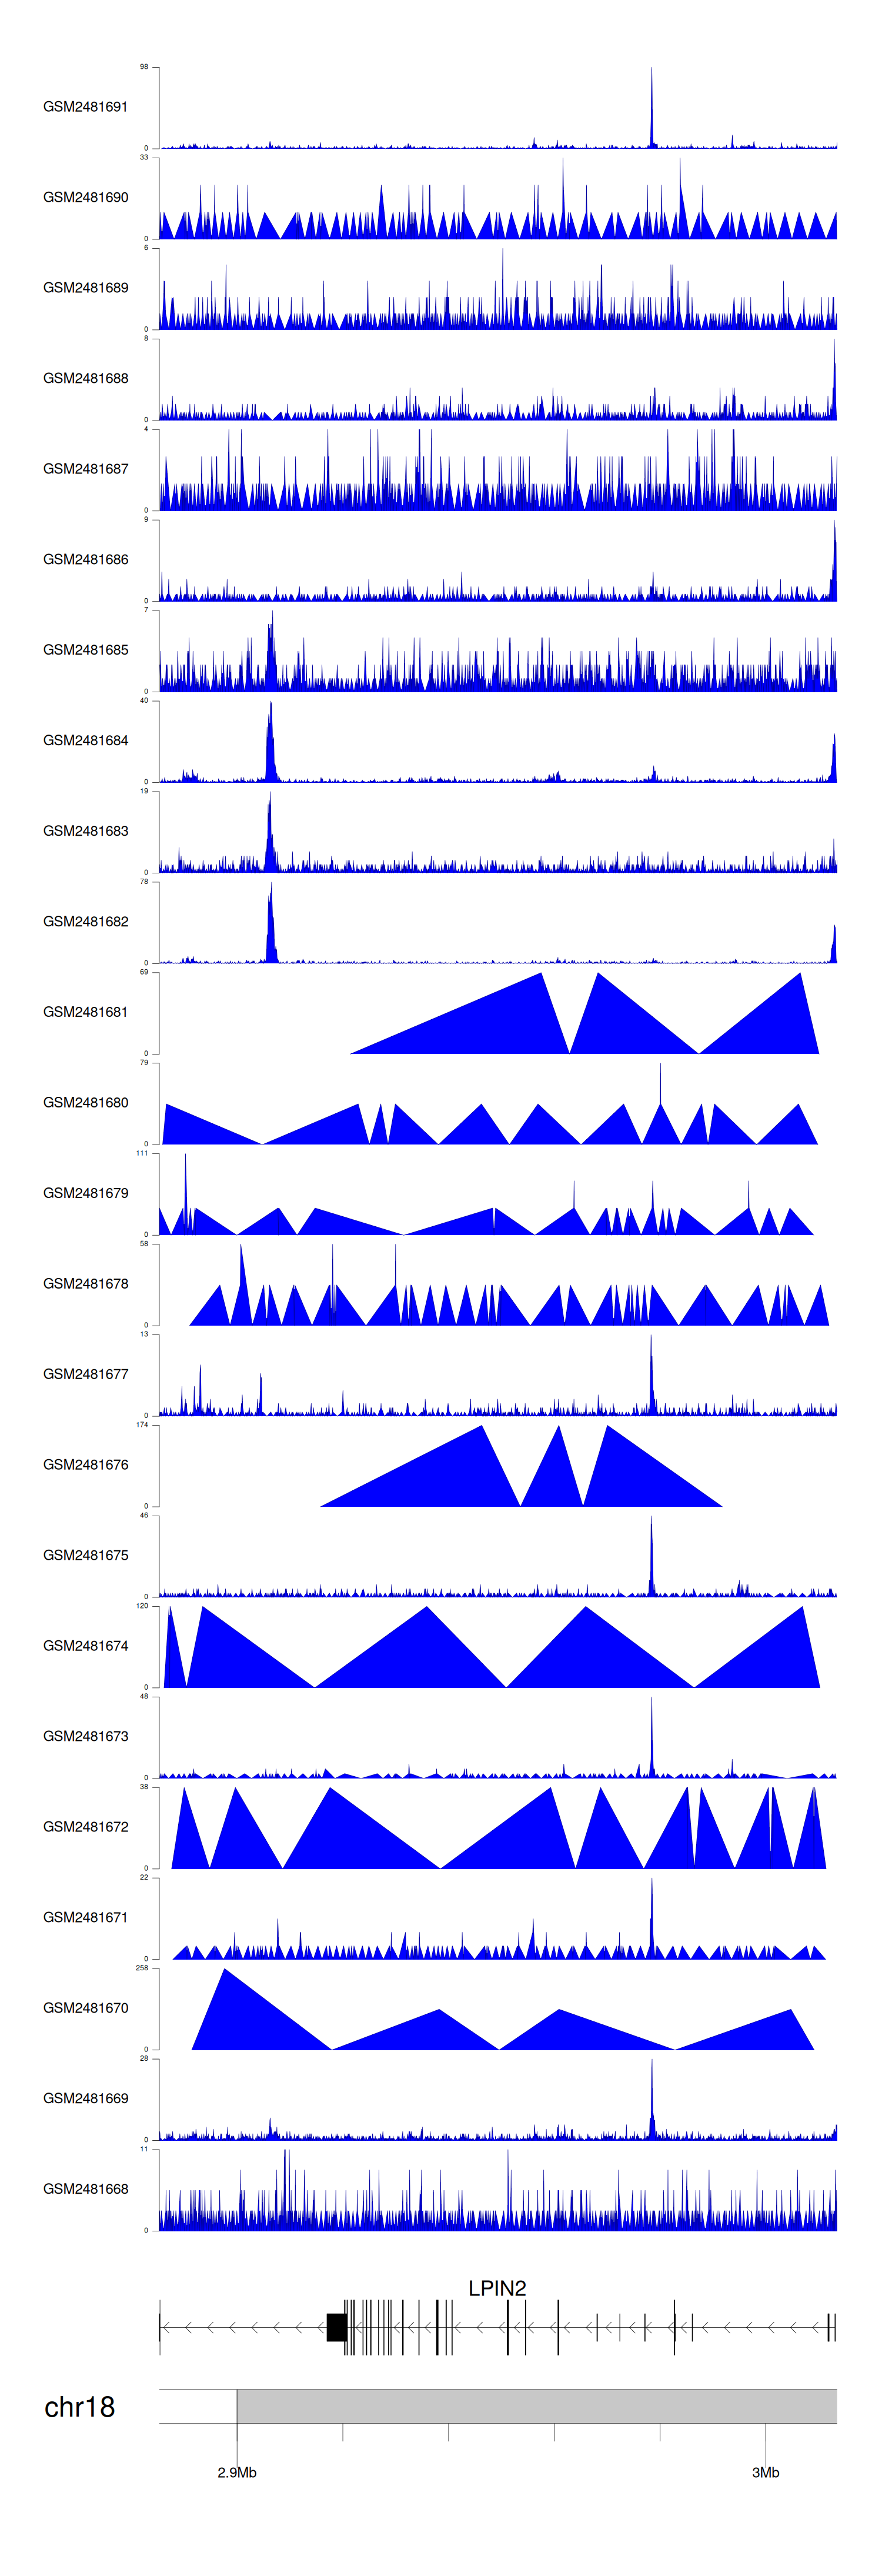
C GSE94732
|
Chip-seq |
24 |
Illumina NextSeq 500 (Homo sapiens);illumina Genome Analyzer IIx (Homo sapiens) |
|
GSE52244
|
Expression array |
15 |
[HuEx-1_0-st] Affymetrix Human Exon 1.0 ST Array [probe set (exon) version] |
|
GSE10789
|
Expression array |
6 |
NCI/ATC Hs-OperonV3 |
|
GSE224047
|
RNA-seq |
10 |
Illumina NextSeq 500 (Homo sapiens) |
|
GSE168557
|
Expression array |
6 |
Agilent-039494 SurePrint G3 Human GE v2 8x60K Microarray 039381 (Feature Number version) |
|
GSE136189
|
Methylation profiling (Array) |
40 |
Illumina HumanMethylation450 BeadChip (HumanMethylation450_15017482);Illumina Infinium HumanMethylation850 BeadChip |
When the gene can detect a peak in the dataset, a peak plot will be displayed.
> Dataset: GSE94732 - LPIN2 peak across samples
|
Peak Plot
|
|
|
