Gene Information
|
Gene Name
|
MAD1L1 |
|
Gene ID
|
8379
|
|
Gene Full Name
|
mitotic arrest deficient 1 like 1 |
|
Gene Alias
|
MAD1|MVA7|PIG9|TP53I9|TXBP181 |
|
Transcripts
|
ENSG00000002822
|
|
Virus
|
HTLV1 |
|
Gene Type
|
protein-coding |
|
HPA Location Info
|
Nucleoplasm, Nuclear membrane; 
|
|
Membrane Info
|
Disease related genes, Human disease related genes, Predicted intracellular proteins |
|
Uniport_ID
|
Q9Y6D9
|
|
HGNC ID
|
HGNC:6762
|
|
OMIM ID
|
602686 |
|
Summary
|
MAD1L1 is a component of the mitotic spindle-assembly checkpoint that prevents the onset of anaphase until all chromosome are properly aligned at the metaphase plate. MAD1L1 functions as a homodimer and interacts with MAD2L1. MAD1L1 may play a role in cell cycle control and tumor suppression. Alternative splicing results in multiple transcript variants. [provided by RefSeq, Jan 2015] |
Target gene [MAD1L1] related to VISs 
Integration Table: if previous studies reported that target gene was altered by virus integration events, the overlap between VISs in this literature and Cistrome factors was listed in this section
Target gene [MAD1L1] related to Omics data
| Data ID |
Experiment type |
Sample number |
Platform |
|
GSE189602
|
Methylation profiling (Array) |
4 |
Infinium MethylationEPIC |
|
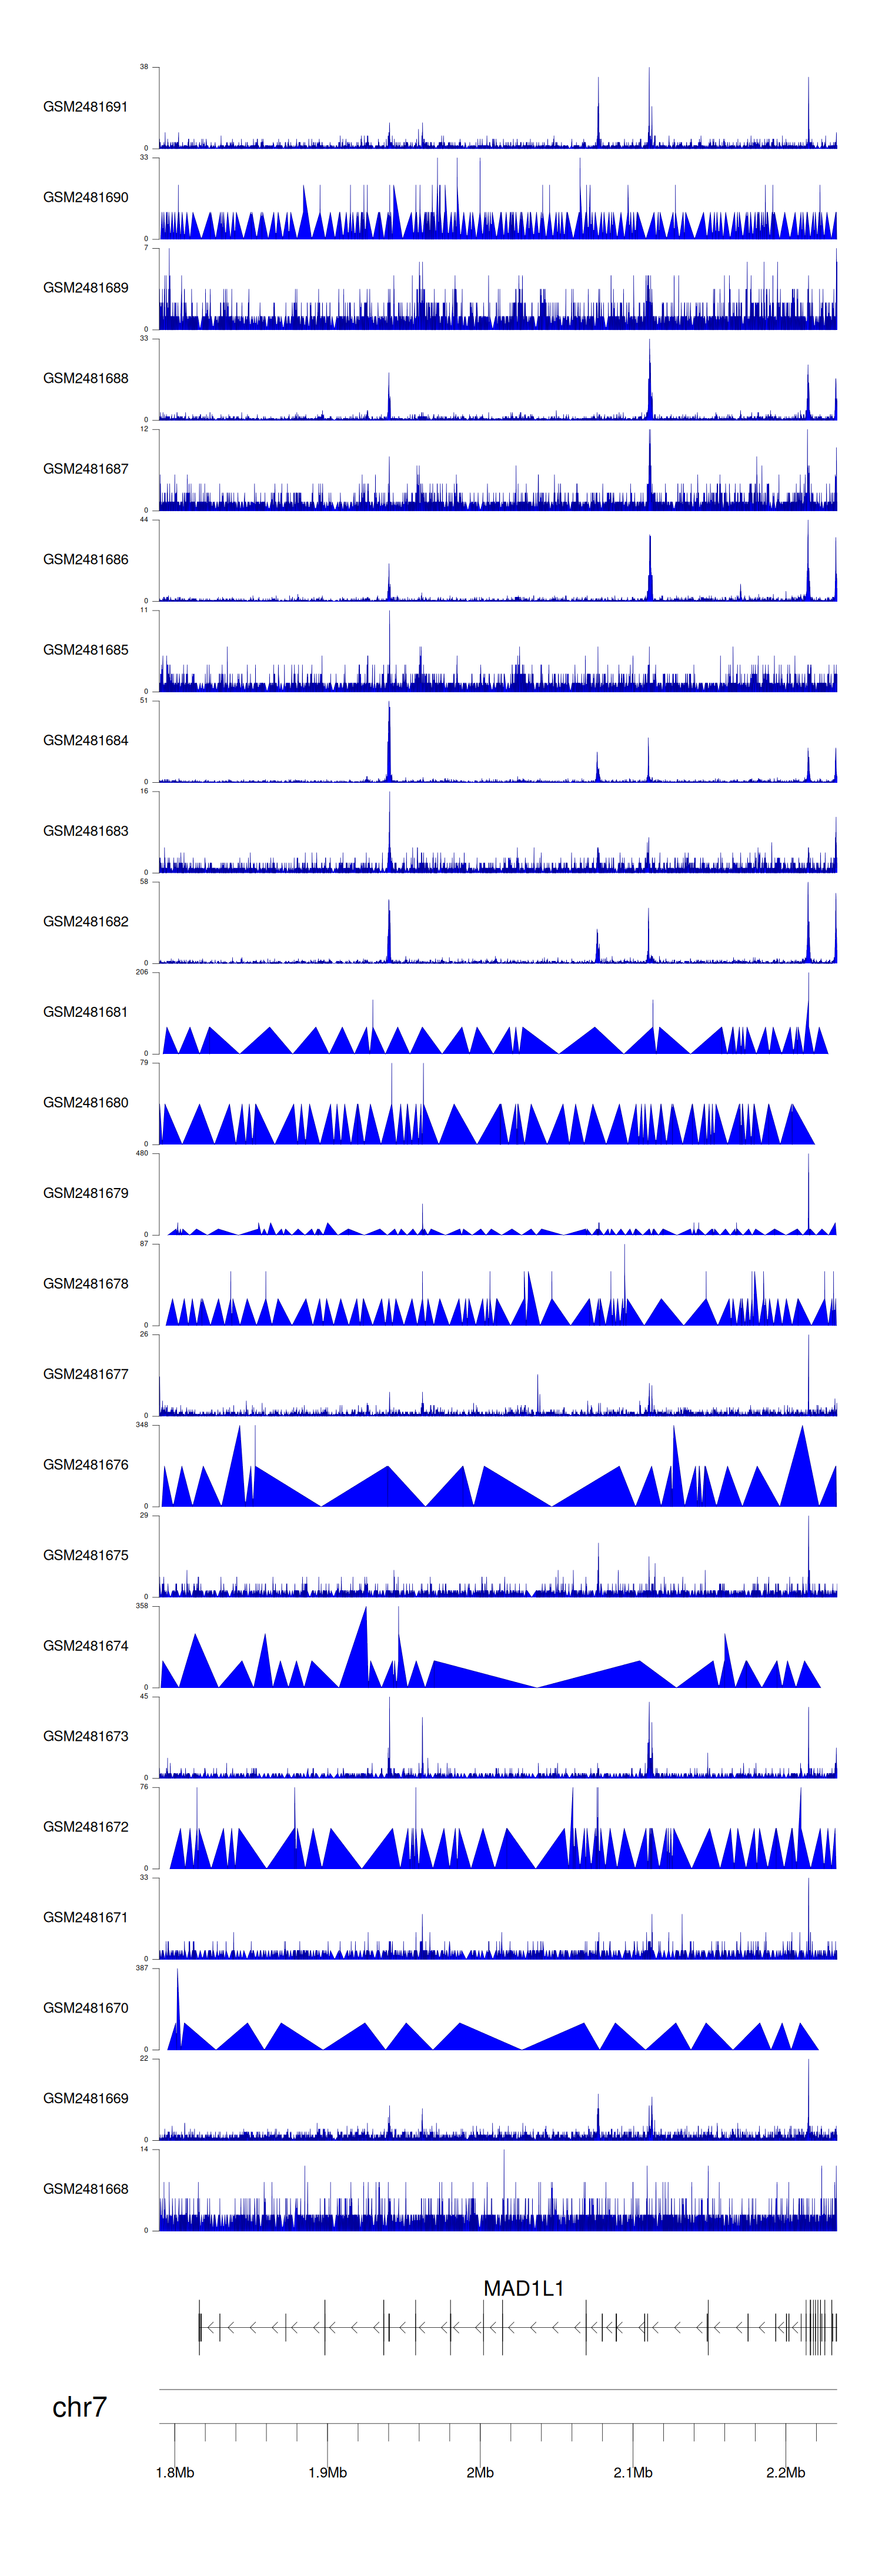
C GSE94732
|
Chip-seq |
24 |
Illumina NextSeq 500 (Homo sapiens);illumina Genome Analyzer IIx (Homo sapiens) |
|
GSE52244
|
Expression array |
15 |
[HuEx-1_0-st] Affymetrix Human Exon 1.0 ST Array [probe set (exon) version] |
|
GSE10789
|
Expression array |
6 |
NCI/ATC Hs-OperonV3 |
|
GSE224047
|
RNA-seq |
10 |
Illumina NextSeq 500 (Homo sapiens) |
|
GSE168557
|
Expression array |
6 |
Agilent-039494 SurePrint G3 Human GE v2 8x60K Microarray 039381 (Feature Number version) |
|
GSE136189
|
Methylation profiling (Array) |
40 |
Illumina HumanMethylation450 BeadChip (HumanMethylation450_15017482);Illumina Infinium HumanMethylation850 BeadChip |
When the gene can detect a peak in the dataset, a peak plot will be displayed.
> Dataset: GSE94732 - MAD1L1 peak across samples
|
Peak Plot
|
|
|
