Gene Information
|
Gene Name
|
MAT1A |
|
Gene ID
|
4143
|
|
Gene Full Name
|
methionine adenosyltransferase 1A |
|
Gene Alias
|
MAT|MATA1|SAMS|SAMS1 |
|
Transcripts
|
ENSG00000151224
|
|
Virus
|
HTLV1 |
|
Gene Type
|
protein-coding |
|
HPA Location Info
|
Nucleoplasm;Cytosol; 
|
|
Membrane Info
|
Disease related genes, Enzymes, Human disease related genes, Metabolic proteins, Plasma proteins, Potential drug targets, Predicted intracellular proteins |
|
Uniport_ID
|
Q00266
|
|
HGNC ID
|
HGNC:6903
|
|
OMIM ID
|
610550 |
|
Summary
|
This gene catalyzes a two-step reaction that involves the transfer of the adenosyl moiety of ATP to methionine to form S-adenosylmethionine and tripolyphosphate, which is subsequently cleaved to PPi and Pi. S-adenosylmethionine is the source of methyl groups for most biological methylations. The encoded protein is found as a homotetramer (MAT I) or a homodimer (MAT III) whereas a third form, MAT II (gamma), is encoded by the MAT2A gene. Mutations in this gene are associated with methionine adenosyltransferase deficiency. [provided by RefSeq, Jul 2008] |
Target gene [MAT1A] related to VISs 
Integration Table: if previous studies reported that target gene was altered by virus integration events, the overlap between VISs in this literature and Cistrome factors was listed in this section
| DVID |
Chromosome |
HM |
TFBS |
CA |
Sum of Overlapped Records |
Detail |
| 6033658 |
chr10 |
202 |
447 |
325 |
974 |
View |
Target gene [MAT1A] related to Omics data
| Data ID |
Experiment type |
Sample number |
Platform |
|
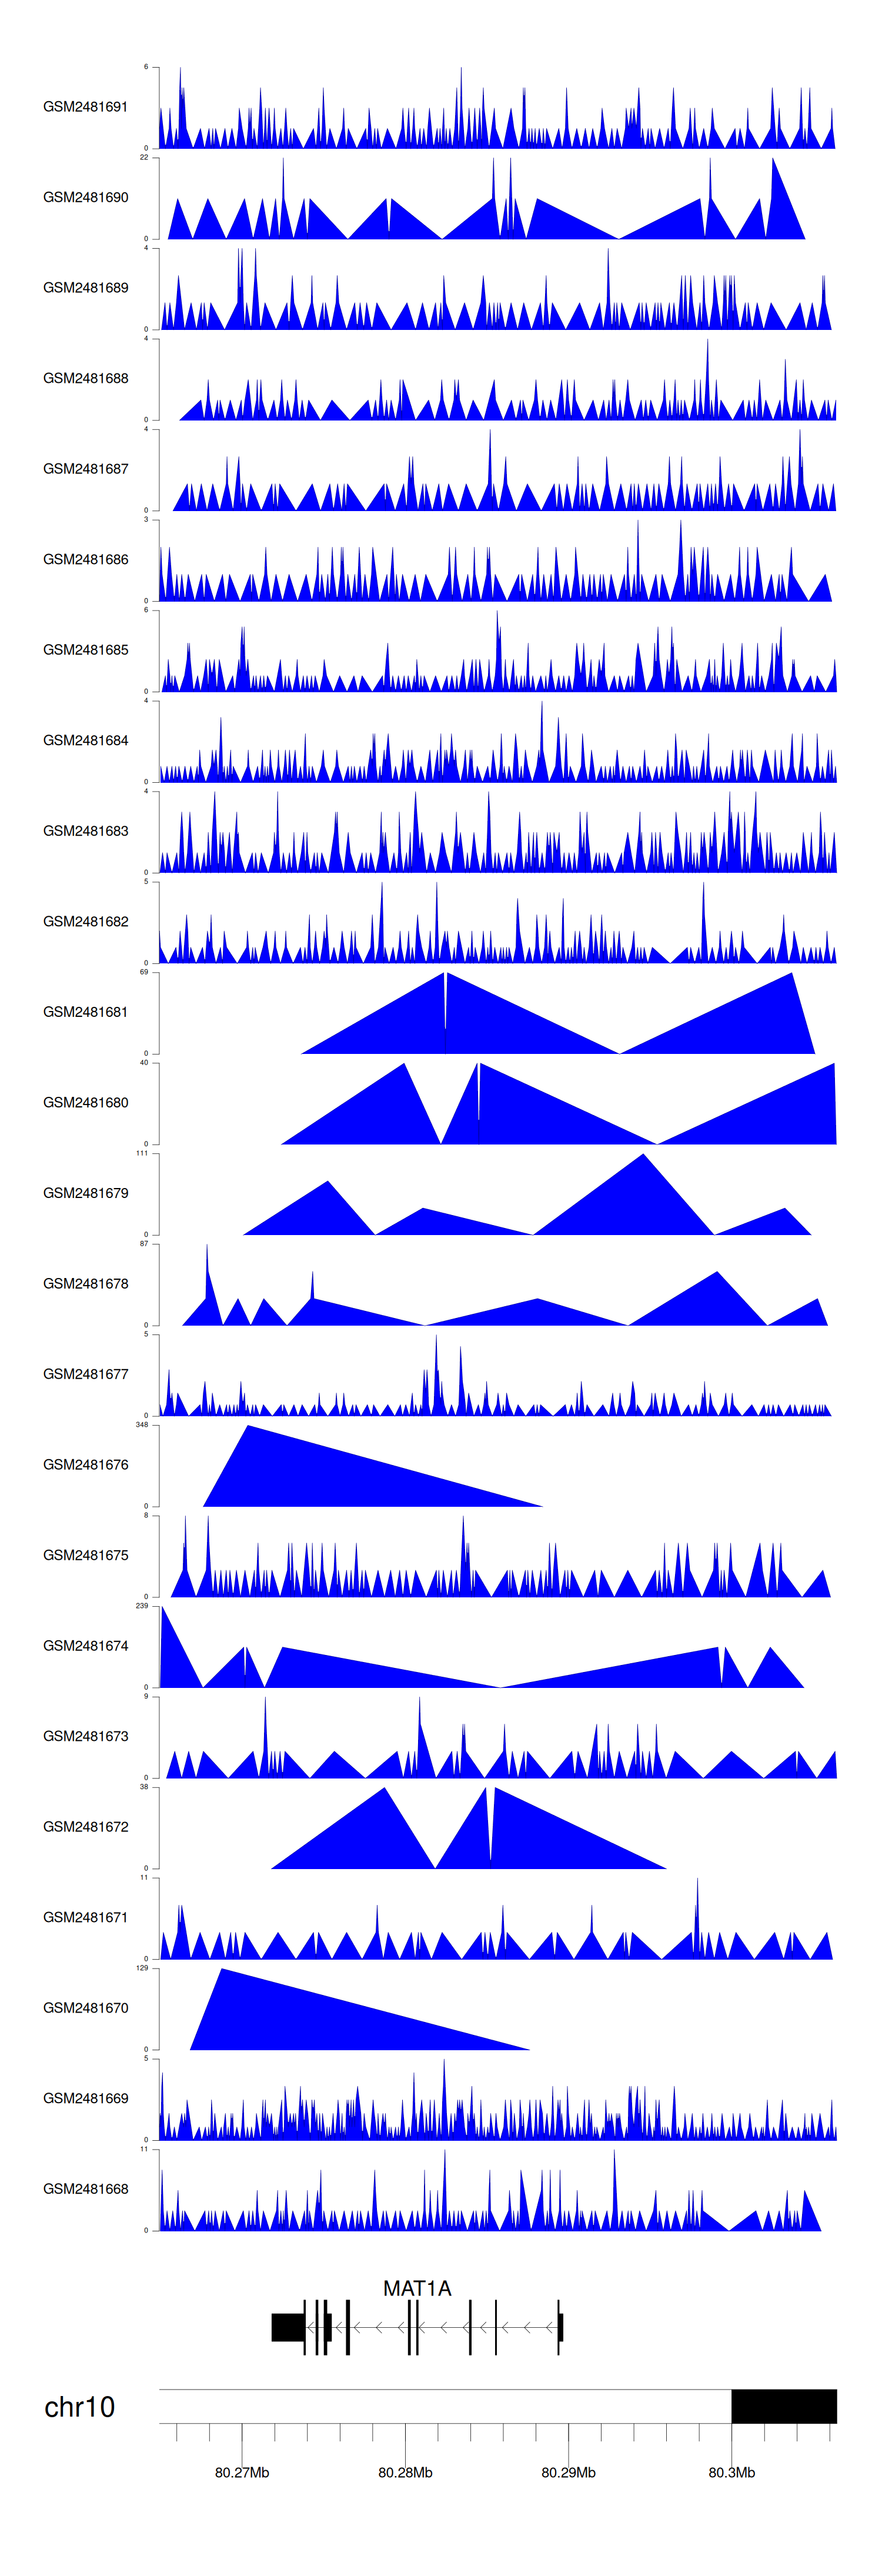
C GSE94732
|
Chip-seq |
24 |
Illumina NextSeq 500 (Homo sapiens);illumina Genome Analyzer IIx (Homo sapiens) |
|
GSE168557
|
Expression array |
6 |
Agilent-039494 SurePrint G3 Human GE v2 8x60K Microarray 039381 (Feature Number version) |
|
GSE52244
|
Expression array |
15 |
[HuEx-1_0-st] Affymetrix Human Exon 1.0 ST Array [probe set (exon) version] |
|
GSE10789
|
Expression array |
6 |
NCI/ATC Hs-OperonV3 |
|
GSE189602
|
Methylation profiling (Array) |
4 |
Infinium MethylationEPIC |
|
GSE136189
|
Methylation profiling (Array) |
40 |
Illumina HumanMethylation450 BeadChip (HumanMethylation450_15017482);Illumina Infinium HumanMethylation850 BeadChip |
When the gene can detect a peak in the dataset, a peak plot will be displayed.
> Dataset: GSE94732 - MAT1A peak across samples
|
Peak Plot
|
|
|
