Gene Information
|
Gene Name
|
MICAL2 |
|
Gene ID
|
9645
|
|
Gene Full Name
|
microtubule associated monooxygenase, calponin and LIM domain containing 2 |
|
Gene Alias
|
Ebitein1|MICAL-2|MICAL2PV1|MICAL2PV2|MICALCL|mical-cL |
|
Transcripts
|
ENSG00000133816
|
|
Virus
|
HTLV1 |
|
Gene Type
|
protein-coding |
|
HPA Location Info
|
Cytosol;Nucleoplasm, Plasma membrane; 
|
|
Membrane Info
|
Enzymes, Predicted intracellular proteins, Predicted membrane proteins |
|
Uniport_ID
|
O94851
|
|
HGNC ID
|
HGNC:24693
|
|
OMIM ID
|
608881 |
|
Summary
|
The protein encoded by this gene is a monooxygenase that enhances depolymerization of F-actin and is therefore involved in cytoskeletal dynamics. The encoded protein is a regulator of the SRF signaling pathway. Increased expression of this gene has been associated with cancer progression and metastasis. [provided by RefSeq, Oct 2016] |
Target gene [MICAL2] related to VISs 
Integration Table: if previous studies reported that target gene was altered by virus integration events, the overlap between VISs in this literature and Cistrome factors was listed in this section
Target gene [MICAL2] related to Omics data
| Data ID |
Experiment type |
Sample number |
Platform |
|
GSE189602
|
Methylation profiling (Array) |
4 |
Infinium MethylationEPIC |
|
C GSE94732
|
Chip-seq |
24 |
Illumina NextSeq 500 (Homo sapiens);illumina Genome Analyzer IIx (Homo sapiens) |
|
GSE52244
|
Expression array |
15 |
[HuEx-1_0-st] Affymetrix Human Exon 1.0 ST Array [probe set (exon) version] |
|
GSE10789
|
Expression array |
6 |
NCI/ATC Hs-OperonV3 |
|
GSE224047
|
RNA-seq |
10 |
Illumina NextSeq 500 (Homo sapiens) |
|
GSE168557
|
Expression array |
6 |
Agilent-039494 SurePrint G3 Human GE v2 8x60K Microarray 039381 (Feature Number version) |
|
GSE136189
|
Methylation profiling (Array) |
40 |
Illumina HumanMethylation450 BeadChip (HumanMethylation450_15017482);Illumina Infinium HumanMethylation850 BeadChip |
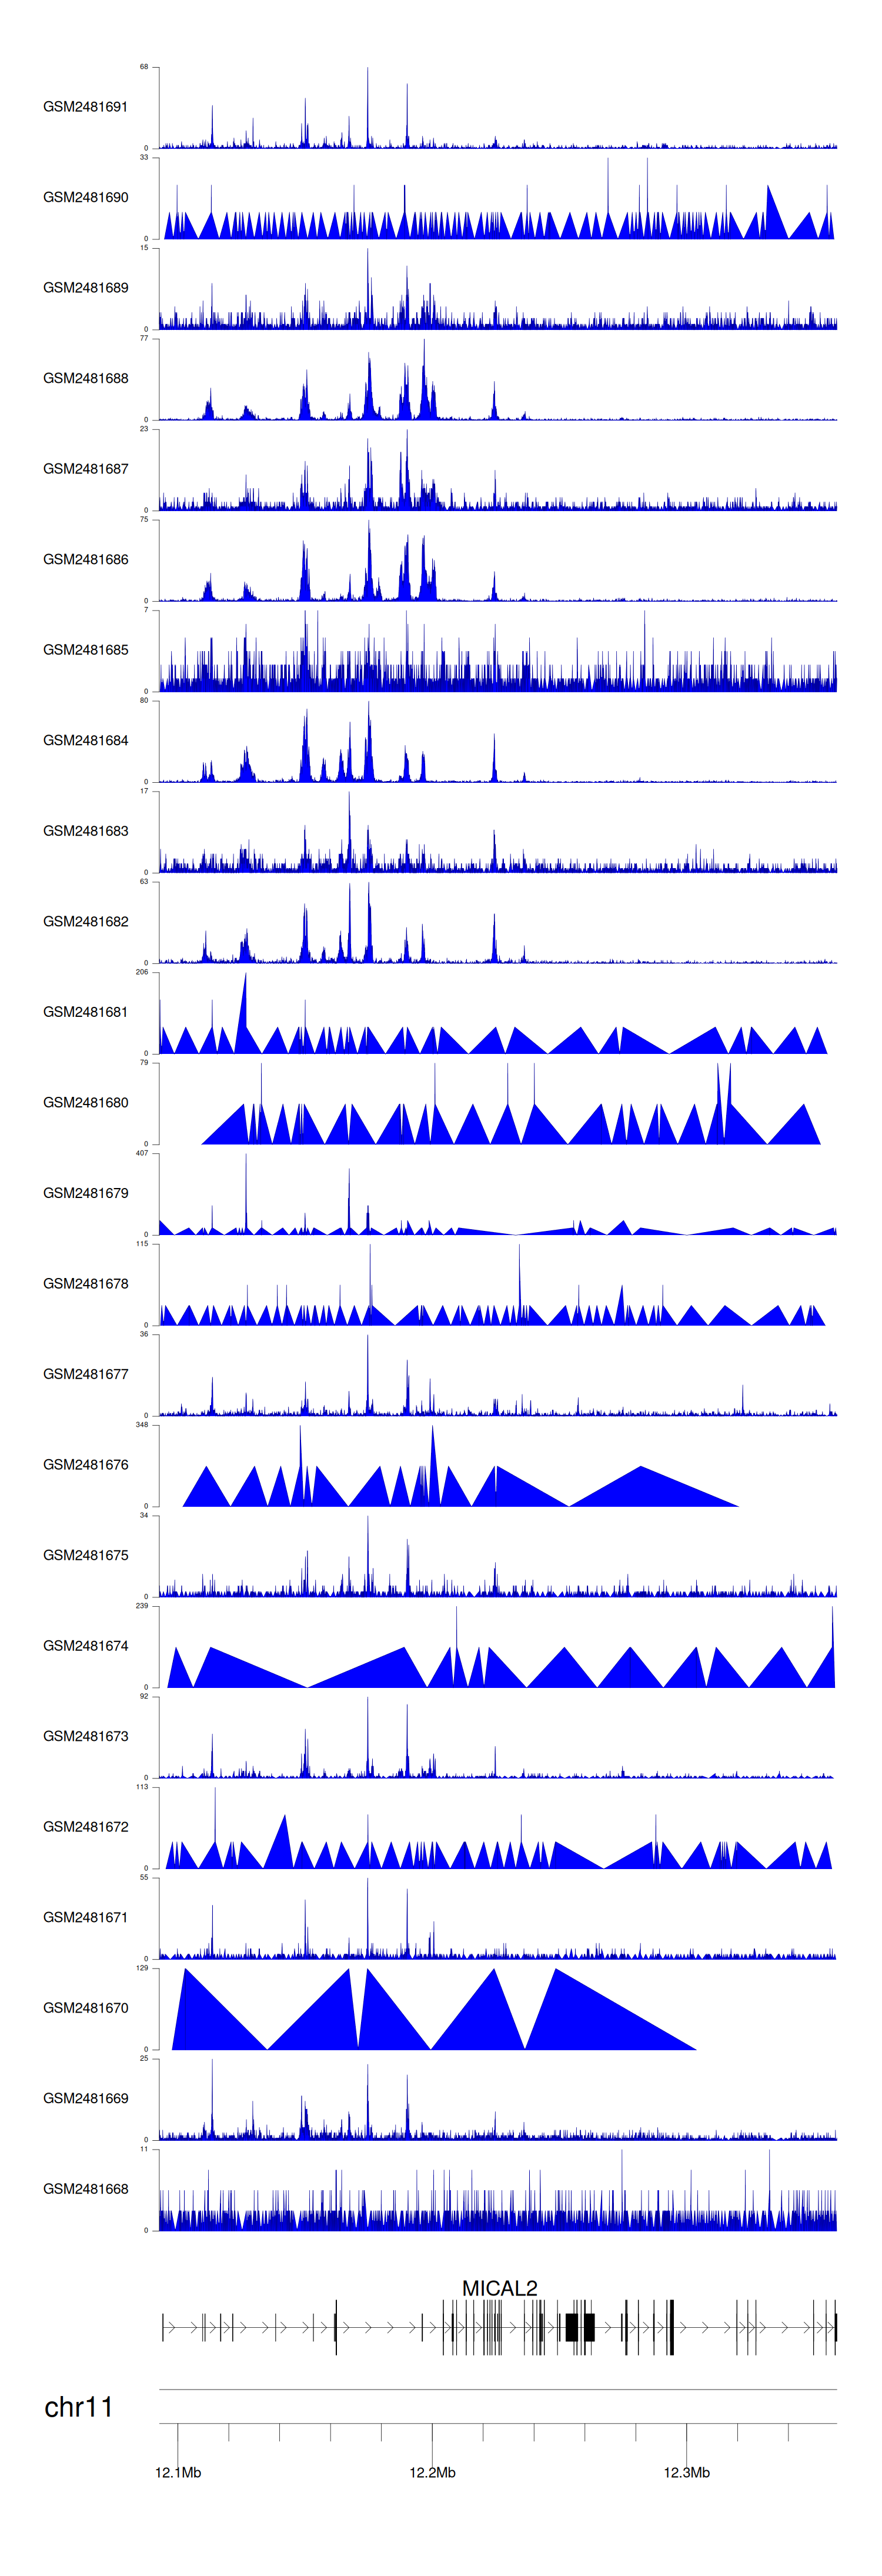
When the gene can detect a peak in the dataset, a peak plot will be displayed.
> Dataset: GSE94732 - MICAL2 peak across samples
|
Peak Plot
|
|
|
