Gene Information
|
Gene Name
|
MICU1 |
|
Gene ID
|
10367
|
|
Gene Full Name
|
mitochondrial calcium uptake 1 |
|
Gene Alias
|
CALC|CBARA1|EFHA3|MPXPS|ara CALC |
|
Transcripts
|
ENSG00000107745
|
|
Virus
|
HTLV1 |
|
Gene Type
|
protein-coding |
|
HPA Location Info
|
Mitochondria; 
|
|
Membrane Info
|
Disease related genes, Human disease related genes, Potential drug targets, Predicted intracellular proteins, Transporters |
|
Uniport_ID
|
Q9BPX6
|
|
HGNC ID
|
HGNC:1530
|
|
OMIM ID
|
605084 |
|
Summary
|
This gene encodes an essential regulator of mitochondrial Ca2+ uptake under basal conditions. The encoded protein interacts with the mitochondrial calcium uniporter, a mitochondrial inner membrane Ca2+ channel, and is essential in preventing mitochondrial Ca2+ overload, which can cause excessive production of reactive oxygen species and cell stress. Alternatively spliced transcript variants encoding different isoforms have been described. [provided by RefSeq, Mar 2013] |
Target gene [MICU1] related to VISs 
Integration Table: if previous studies reported that target gene was altered by virus integration events, the overlap between VISs in this literature and Cistrome factors was listed in this section
| DVID |
Chromosome |
HM |
TFBS |
CA |
Sum of Overlapped Records |
Detail |
| 6003266 |
chr10 |
166 |
5 |
0 |
171 |
View |
| 6019067 |
chr10 |
6 |
2 |
0 |
8 |
View |
| 6023175 |
chr10 |
3 |
1 |
0 |
4 |
View |
Target gene [MICU1] related to Omics data
| Data ID |
Experiment type |
Sample number |
Platform |
|
GSE189602
|
Methylation profiling (Array) |
4 |
Infinium MethylationEPIC |
|
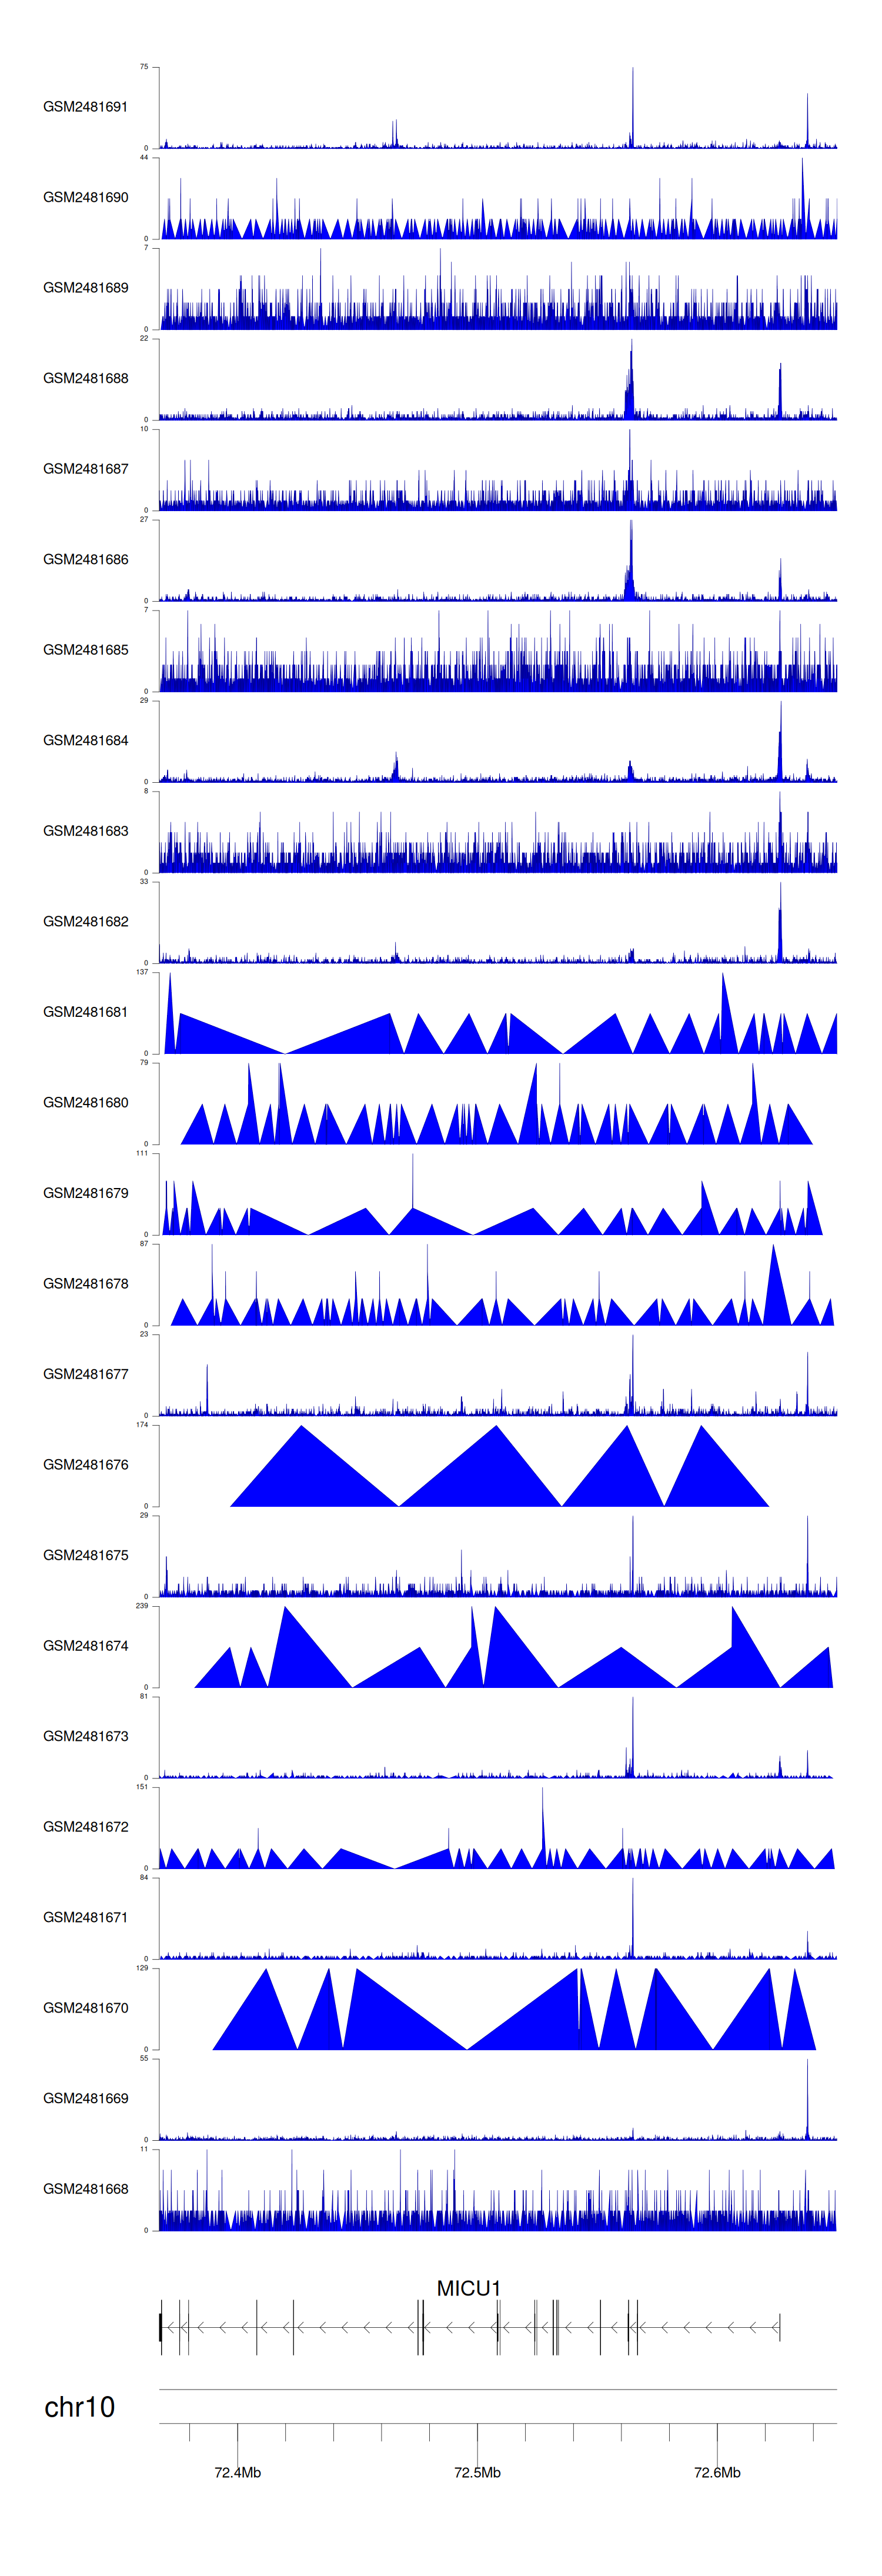
C GSE94732
|
Chip-seq |
24 |
Illumina NextSeq 500 (Homo sapiens);illumina Genome Analyzer IIx (Homo sapiens) |
|
GSE52244
|
Expression array |
15 |
[HuEx-1_0-st] Affymetrix Human Exon 1.0 ST Array [probe set (exon) version] |
|
GSE10789
|
Expression array |
6 |
NCI/ATC Hs-OperonV3 |
|
GSE224047
|
RNA-seq |
10 |
Illumina NextSeq 500 (Homo sapiens) |
|
GSE168557
|
Expression array |
6 |
Agilent-039494 SurePrint G3 Human GE v2 8x60K Microarray 039381 (Feature Number version) |
When the gene can detect a peak in the dataset, a peak plot will be displayed.
> Dataset: GSE94732 - MICU1 peak across samples
|
Peak Plot
|
|
|
