Gene Information
|
Gene Name
|
MTOR |
|
Gene ID
|
2475
|
|
Gene Full Name
|
mechanistic target of rapamycin kinase |
|
Gene Alias
|
FRAP|FRAP1|FRAP2|RAFT1|RAPT1|SKS |
|
Transcripts
|
ENSG00000198793
|
|
Virus
|
HBV |
|
Gene Type
|
protein-coding |
|
HPA Location Info
|
Golgi apparatus, Cytosol; 
|
|
Membrane Info
|
Cancer-related genes, Disease related genes, Enzymes, FDA approved drug targets, Human disease related genes, Plasma proteins, Predicted intracellular proteins |
|
Uniport_ID
|
P42345
|
|
HGNC ID
|
HGNC:3942
|
|
OMIM ID
|
601231 |
|
Summary
|
The protein encoded by this gene belongs to a family of phosphatidylinositol kinase-related kinases. These kinases mediate cellular responses to stresses such as DNA damage and nutrient deprivation. This kinase is a component of two distinct complexes, mTORC1, which controls protein synthesis, cell growth and proliferation, and mTORC2, which is a regulator of the actin cytoskeleton, and promotes cell survival and cell cycle progression. This protein acts as the target for the cell-cycle arrest and immunosuppressive effects of the FKBP12-rapamycin complex. Inhibitors of mTOR are used in organ transplants as immunosuppressants, and are being evaluated for their therapeutic potential in SARS-CoV-2 infections. Mutations in this gene are associated with Smith-Kingsmore syndrome and somatic focal cortical dysplasia type II. The ANGPTL7 gene is located in an intron of this gene. [provided by RefSeq, Aug 2020] |
Target gene [MTOR] related to VISs 
Integration Table: if previous studies reported that target gene was altered by virus integration events, the overlap between VISs in this literature and Cistrome factors was listed in this section
| DVID |
Chromosome |
HM |
TFBS |
CA |
Sum of Overlapped Records |
Detail |
| 1008500 |
chr1 |
13 |
5 |
2 |
20 |
View |
Target gene [MTOR] related to Omics data
| Data ID |
Experiment type |
Sample number |
Platform |
|
GSE236281
|
RNA-seq |
12 |
Illumina MiSeq (Homo sapiens) |
|
C GSE35465
|
Chip-seq;RNA-seq |
6 |
Illumina HiSeq 2000 (Homo sapiens) |
|
C GSE68402
|
Chip-seq |
26 |
Illumina MiSeq (Homo sapiens);Illumina HiSeq 2500 (Homo sapiens) |
|
GSE247322
|
scRNA-seq |
27 |
Illumina NovaSeq 6000 (Homo sapiens) |
|
TCGA_LIHC_HBV
|
DNA methylation sequencing;RNA-seq |
97 |
TCGA |
|
C GSE270130
|
Chip-seq |
27 |
Illumina NovaSeq 6000 (Homo sapiens) |
|
GSE224901
|
RNA-seq |
21 |
Illumina NovaSeq 6000 (Homo sapiens) |
|
GSE100400
|
Chip-seq;RNA-seq;4C_cccDNA |
31 |
Illumina NextSeq 500 (Homo sapiens);Illumina NextSeq 500 (Mus musculus) |
|
GSE173897
|
RNA-seq |
95 |
Illumina HiSeq 4000 (Homo sapiens) |
|
GSE262515
|
RNA-seq |
21 |
Illumina HiSeq 2500 (Homo sapiens);Illumina HiSeq 2500 (Mus musculus) |
|
GSE110345
|
RNA-seq |
4 |
Illumina HiSeq 2500 (Homo sapiens) |
|
C GSE131257
|
ATAC-seq;RNA-seq |
19 |
Illumina HiSeq 2500 (Homo sapiens) |
|
GSE94660
|
RNA-seq |
42 |
Illumina HiSeq 2500 (Homo sapiens) |
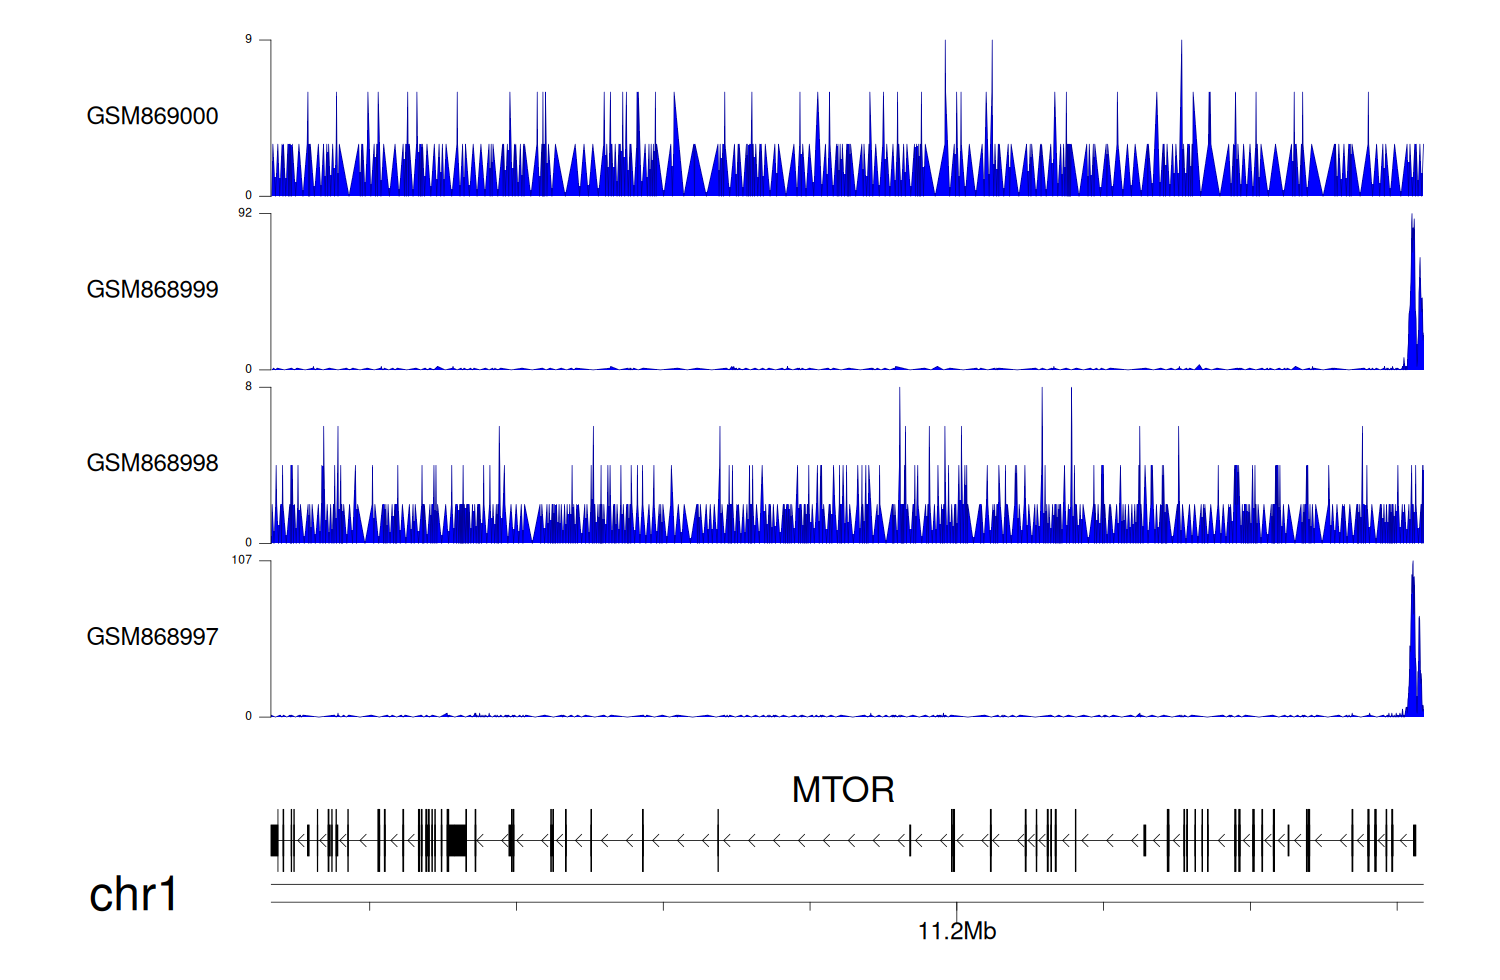
When the gene can detect a peak in the dataset, a peak plot will be displayed.
> Dataset: GSE35465 - MTOR peak across samples
|
Peak Plot
|
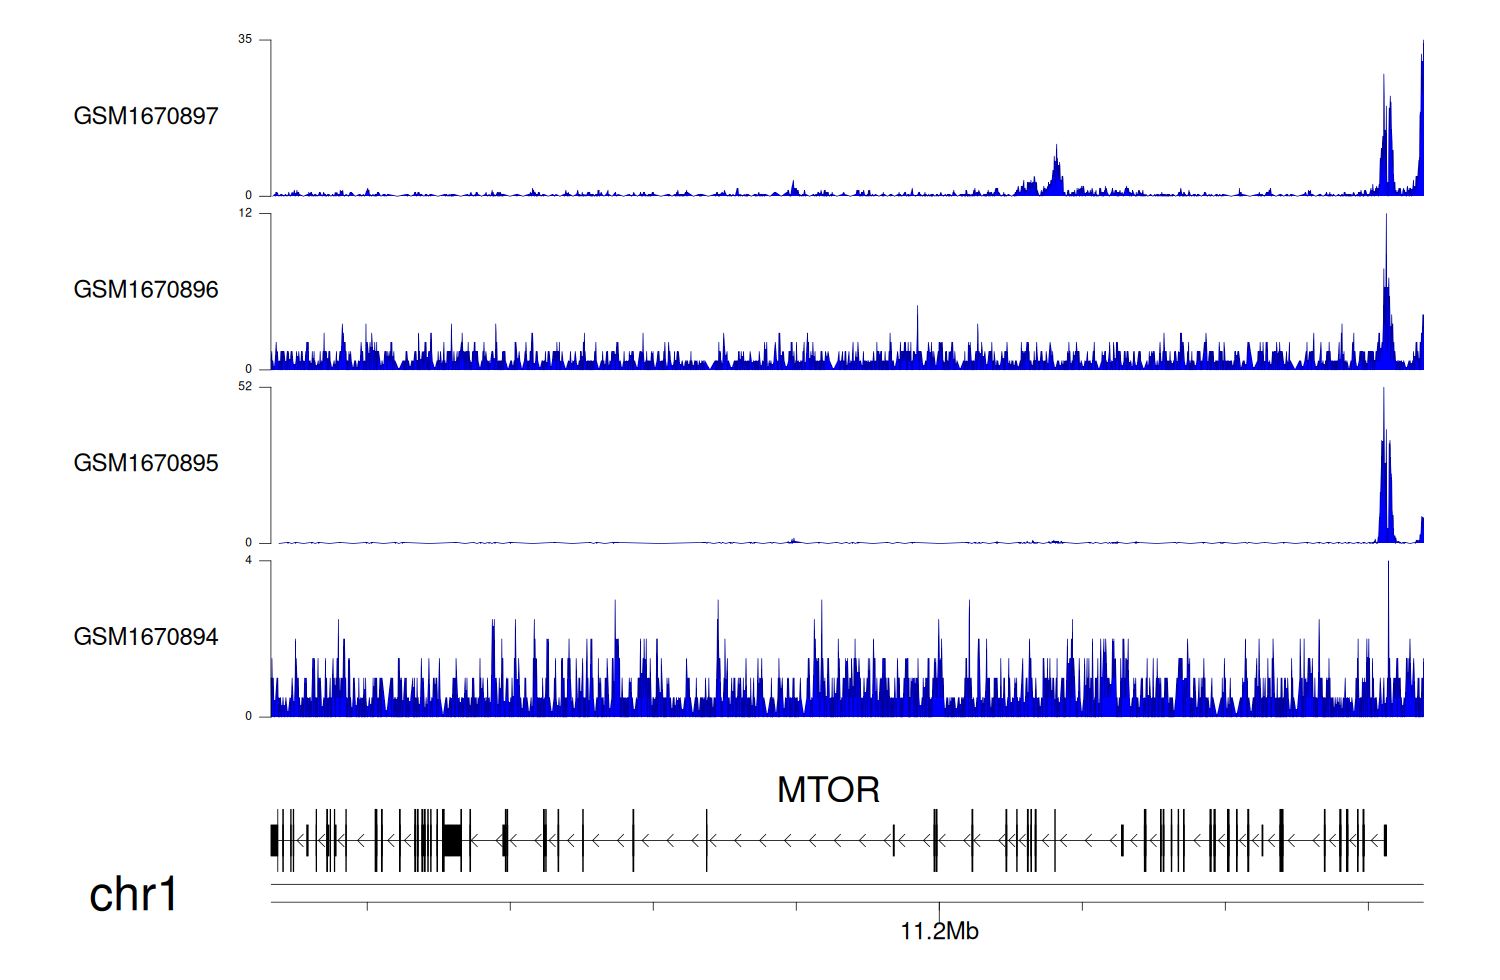
> Dataset: GSE68402 - MTOR peak across samples
|
Peak Plot
|
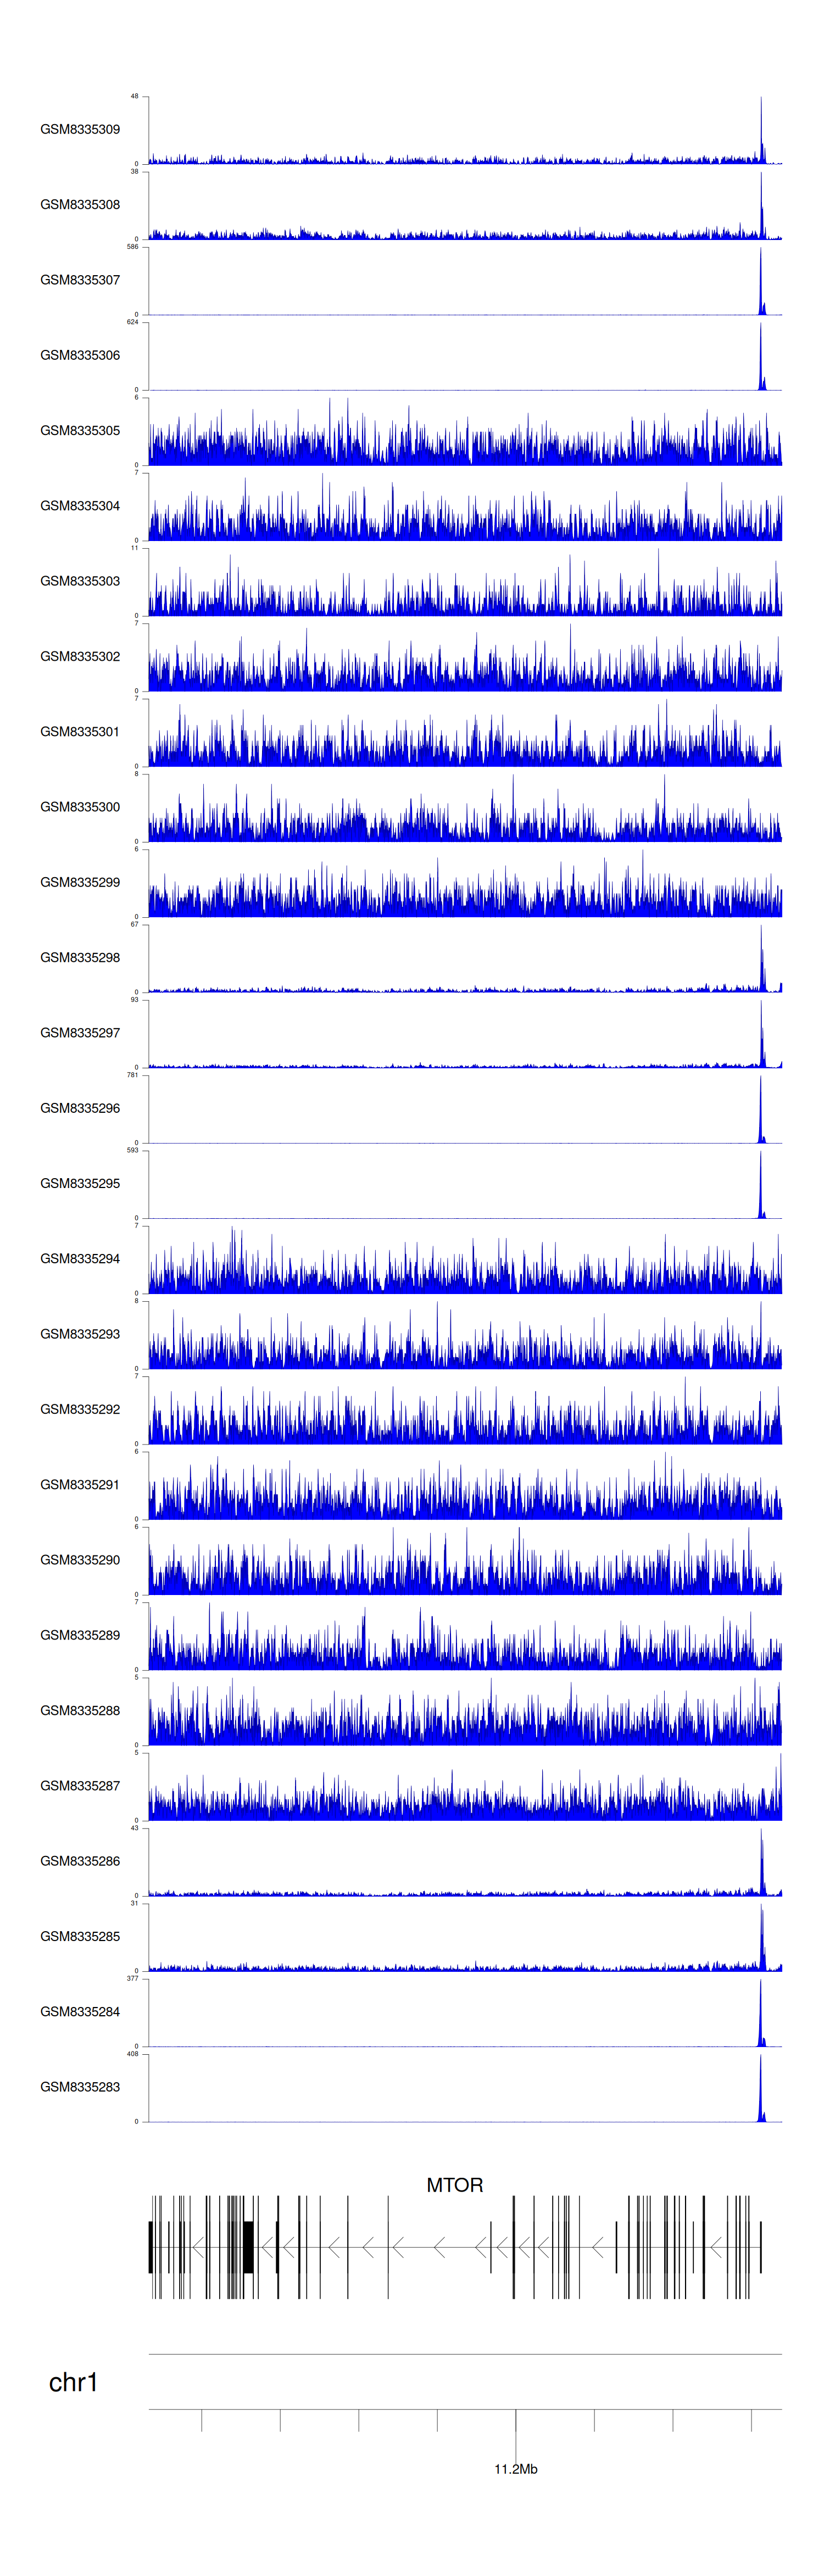
> Dataset: GSE270130 - MTOR peak across samples
|
Peak Plot
|
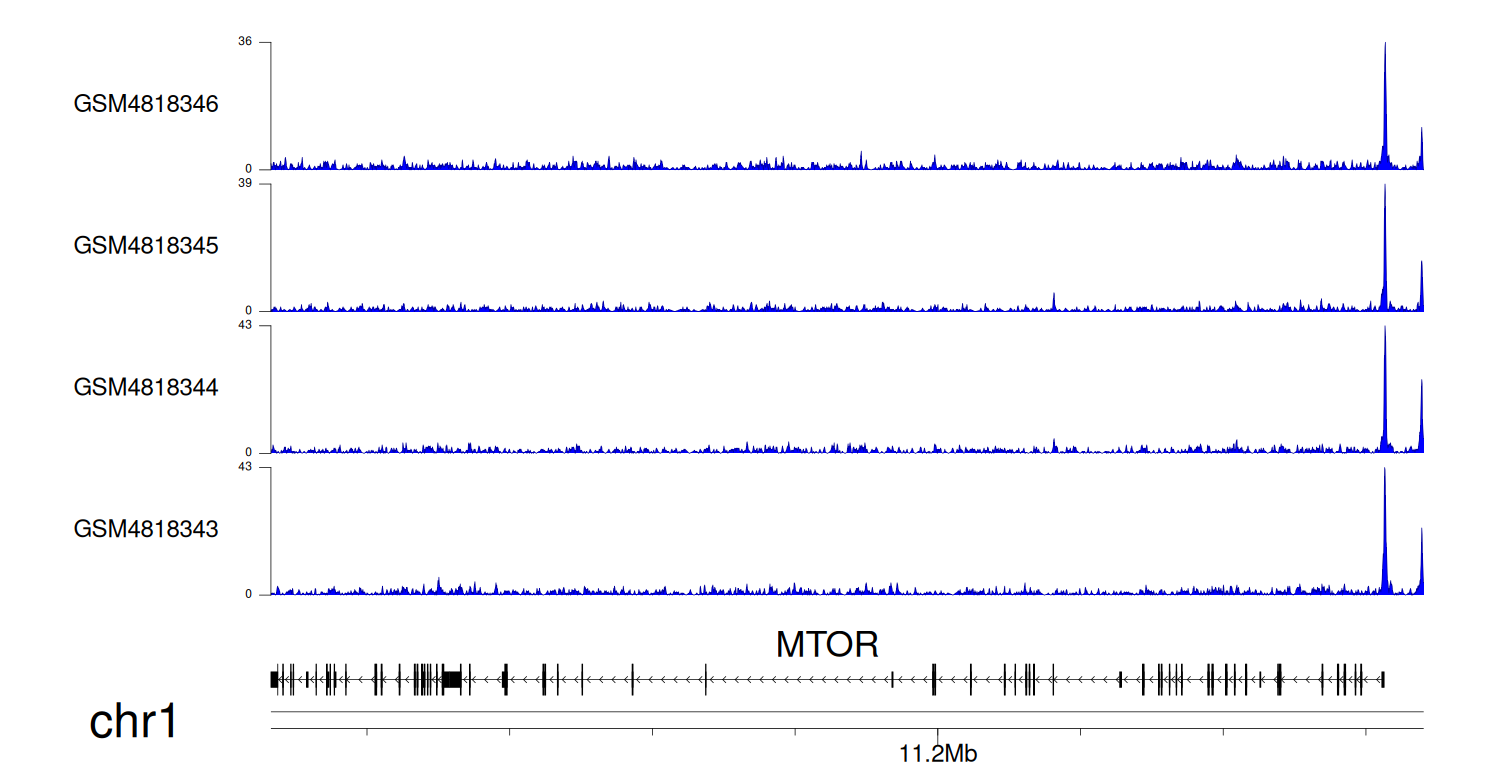
> Dataset: GSE131257 - MTOR peak across samples
|
Peak Plot
|
|
|
