Gene Information
|
Gene Name
|
MYOF |
|
Gene ID
|
26509
|
|
Gene Full Name
|
myoferlin |
|
Gene Alias
|
FER1L3|HAE7 |
|
Transcripts
|
ENSG00000138119
|
|
Virus
|
HTLV1 |
|
Gene Type
|
protein-coding |
|
HPA Location Info
|
Vesicles, Plasma membrane, Centriolar satellite;Primary cilium, Primary cilium tip, Basal body; 
|
|
Membrane Info
|
Disease related genes, Human disease related genes, Plasma proteins, Potential drug targets, Predicted intracellular proteins, Predicted membrane proteins, Transporters |
|
Uniport_ID
|
Q9NZM1
|
|
HGNC ID
|
HGNC:3656
|
|
OMIM ID
|
604603 |
|
Summary
|
Mutations in dysferlin, a protein associated with the plasma membrane, can cause muscle weakness that affects both proximal and distal muscles. The protein encoded by this gene is a type II membrane protein that is structurally similar to dysferlin. It is a member of the ferlin family and associates with both plasma and nuclear membranes. The protein contains C2 domains that play a role in calcium-mediated membrane fusion events, suggesting that it may be involved in membrane regeneration and repair. Two transcript variants encoding different isoforms have been found for this gene. Other possible variants have been detected, but their full-length nature has not been determined. [provided by RefSeq, Dec 2008] |
Target gene [MYOF] related to VISs 
Integration Table: if previous studies reported that target gene was altered by virus integration events, the overlap between VISs in this literature and Cistrome factors was listed in this section
| DVID |
Chromosome |
HM |
TFBS |
CA |
Sum of Overlapped Records |
Detail |
| 6007459 |
chr10 |
7 |
40 |
8 |
55 |
View |
| 6016501 |
chr10 |
2 |
4 |
6 |
12 |
View |
| 6018159 |
chr10 |
1 |
5 |
3 |
9 |
View |
Target gene [MYOF] related to Omics data
| Data ID |
Experiment type |
Sample number |
Platform |
|
GSE189602
|
Methylation profiling (Array) |
4 |
Infinium MethylationEPIC |
|
C GSE94732
|
Chip-seq |
24 |
Illumina NextSeq 500 (Homo sapiens);illumina Genome Analyzer IIx (Homo sapiens) |
|
GSE52244
|
Expression array |
15 |
[HuEx-1_0-st] Affymetrix Human Exon 1.0 ST Array [probe set (exon) version] |
|
GSE10789
|
Expression array |
6 |
NCI/ATC Hs-OperonV3 |
|
GSE224047
|
RNA-seq |
10 |
Illumina NextSeq 500 (Homo sapiens) |
|
GSE168557
|
Expression array |
6 |
Agilent-039494 SurePrint G3 Human GE v2 8x60K Microarray 039381 (Feature Number version) |
|
GSE136189
|
Methylation profiling (Array) |
40 |
Illumina HumanMethylation450 BeadChip (HumanMethylation450_15017482);Illumina Infinium HumanMethylation850 BeadChip |
When the gene can detect a peak in the dataset, a peak plot will be displayed.
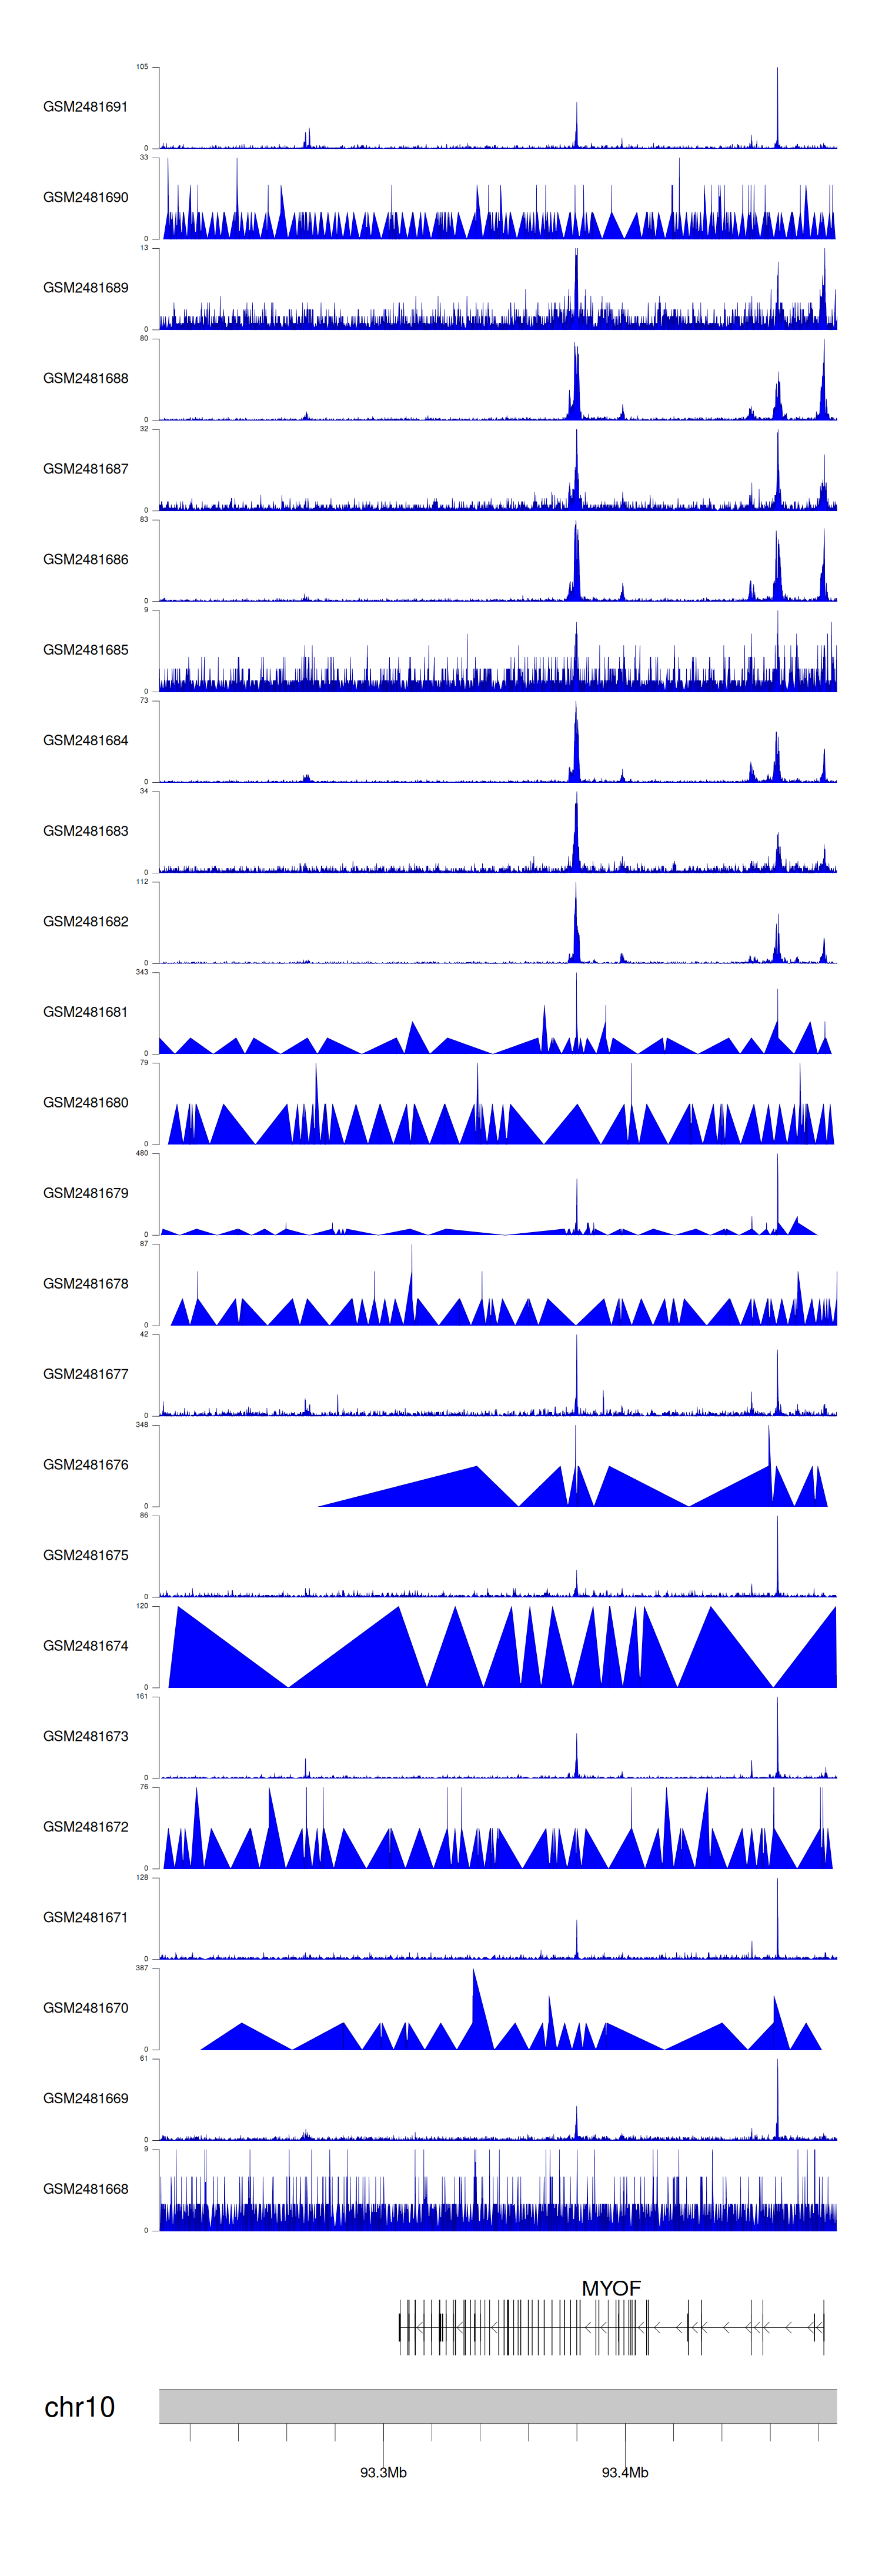
> Dataset: GSE94732 - MYOF peak across samples
|
Peak Plot
|
|
|
