Gene Information
|
Gene Name
|
NALCN |
|
Gene ID
|
259232
|
|
Gene Full Name
|
sodium leak channel, non-selective |
|
Gene Alias
|
CLIFAHDD|CanIon|IHPRF|IHPRF1|INNFD|VGCNL1|bA430M15.1 |
|
Transcripts
|
ENSG00000102452
|
|
Virus
|
HBV |
|
Gene Type
|
protein-coding |
|
HPA Location Info
|
Microtubules, Primary cilium, Cytosol;Nucleoli, Plasma membrane, Cytokinetic bridge, Mitotic spindle; 
|
|
Membrane Info
|
Disease related genes, Human disease related genes, Potential drug targets, Predicted intracellular proteins, Predicted membrane proteins, Transporters |
|
Uniport_ID
|
Q8IZF0
|
|
HGNC ID
|
HGNC:19082
|
|
OMIM ID
|
611549 |
|
Summary
|
This gene encodes a voltage-independent, nonselective cation channel which belongs to a family of voltage-gated sodium and calcium channels that regulates the resting membrane potential and excitability of neurons. This family is expressed throughout the nervous system and conducts a persistent sodium leak current that contributes to tonic neuronal excitability. The encoded protein forms a channelosome complex that includes G-protein-coupled receptors, UNC-79, UNC-80, NCA localization factor-1, and src family tyrosine kinases. Naturally occurring mutations in this gene are associated with infantile neuroaxonal dystrophy, infantile hypotonia with psychomotor retardation and characteristic facies (IHPRF) syndrome, and congenital contractures of the limbs and face with hypotonia and developmental delay (CLIFAHDD) syndrome. A knockout of the orthologous gene in mice results in paralysis with a severely disrupted respiratory rhythm, and lethality within 24 hours after birth. [provided by RefSeq, Apr 2017] |
Target gene [NALCN] related to VISs 
Integration Table: if previous studies reported that target gene was altered by virus integration events, the overlap between VISs in this literature and Cistrome factors was listed in this section
Target gene [NALCN] related to Omics data
| Data ID |
Experiment type |
Sample number |
Platform |
|
GSE236281
|
RNA-seq |
12 |
Illumina MiSeq (Homo sapiens) |
|
C GSE35465
|
Chip-seq;RNA-seq |
6 |
Illumina HiSeq 2000 (Homo sapiens) |
|
C GSE68402
|
Chip-seq |
26 |
Illumina MiSeq (Homo sapiens);Illumina HiSeq 2500 (Homo sapiens) |
|
TCGA_LIHC_HBV
|
DNA methylation sequencing;RNA-seq |
97 |
TCGA |
|
C GSE270130
|
Chip-seq |
27 |
Illumina NovaSeq 6000 (Homo sapiens) |
|
C GSE64877
|
Chip-seq |
2 |
Illumina Genome Analyzer (Homo sapiens) |
|
GSE224901
|
RNA-seq |
21 |
Illumina NovaSeq 6000 (Homo sapiens) |
|
GSE100400
|
Chip-seq;RNA-seq;4C_cccDNA |
31 |
Illumina NextSeq 500 (Homo sapiens);Illumina NextSeq 500 (Mus musculus) |
|
GSE173897
|
RNA-seq |
95 |
Illumina HiSeq 4000 (Homo sapiens) |
|
GSE262515
|
RNA-seq |
21 |
Illumina HiSeq 2500 (Homo sapiens);Illumina HiSeq 2500 (Mus musculus) |
|
GSE110345
|
RNA-seq |
4 |
Illumina HiSeq 2500 (Homo sapiens) |
|
C GSE131257
|
ATAC-seq;RNA-seq |
19 |
Illumina HiSeq 2500 (Homo sapiens) |
|
GSE94660
|
RNA-seq |
42 |
Illumina HiSeq 2500 (Homo sapiens) |
When the gene can detect a peak in the dataset, a peak plot will be displayed.
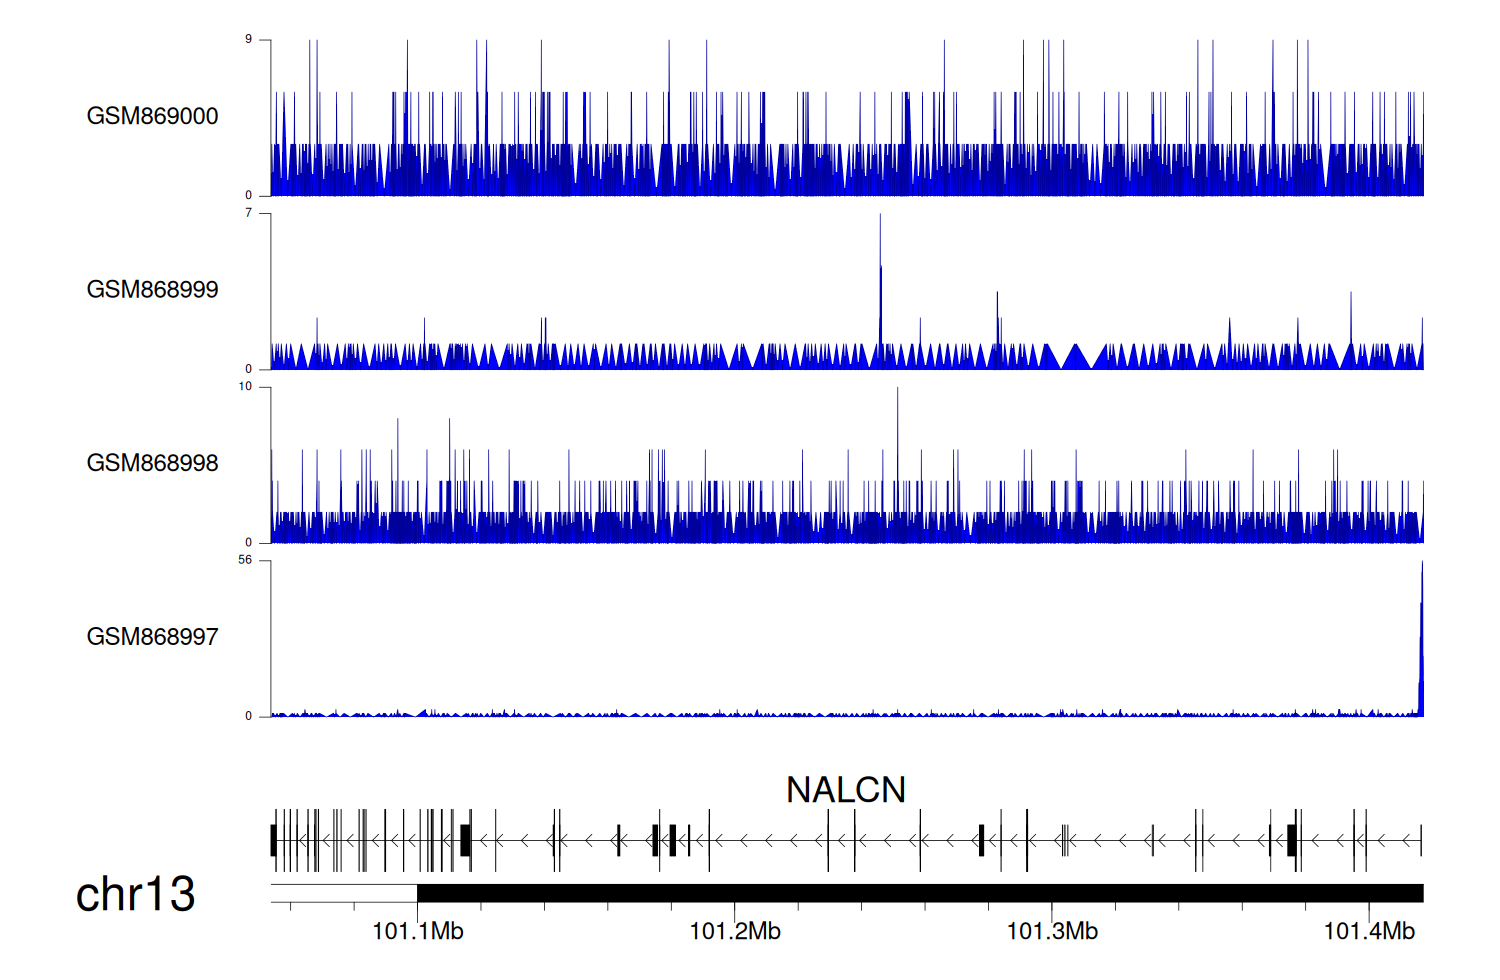
> Dataset: GSE35465 - NALCN peak across samples
|
Peak Plot
|
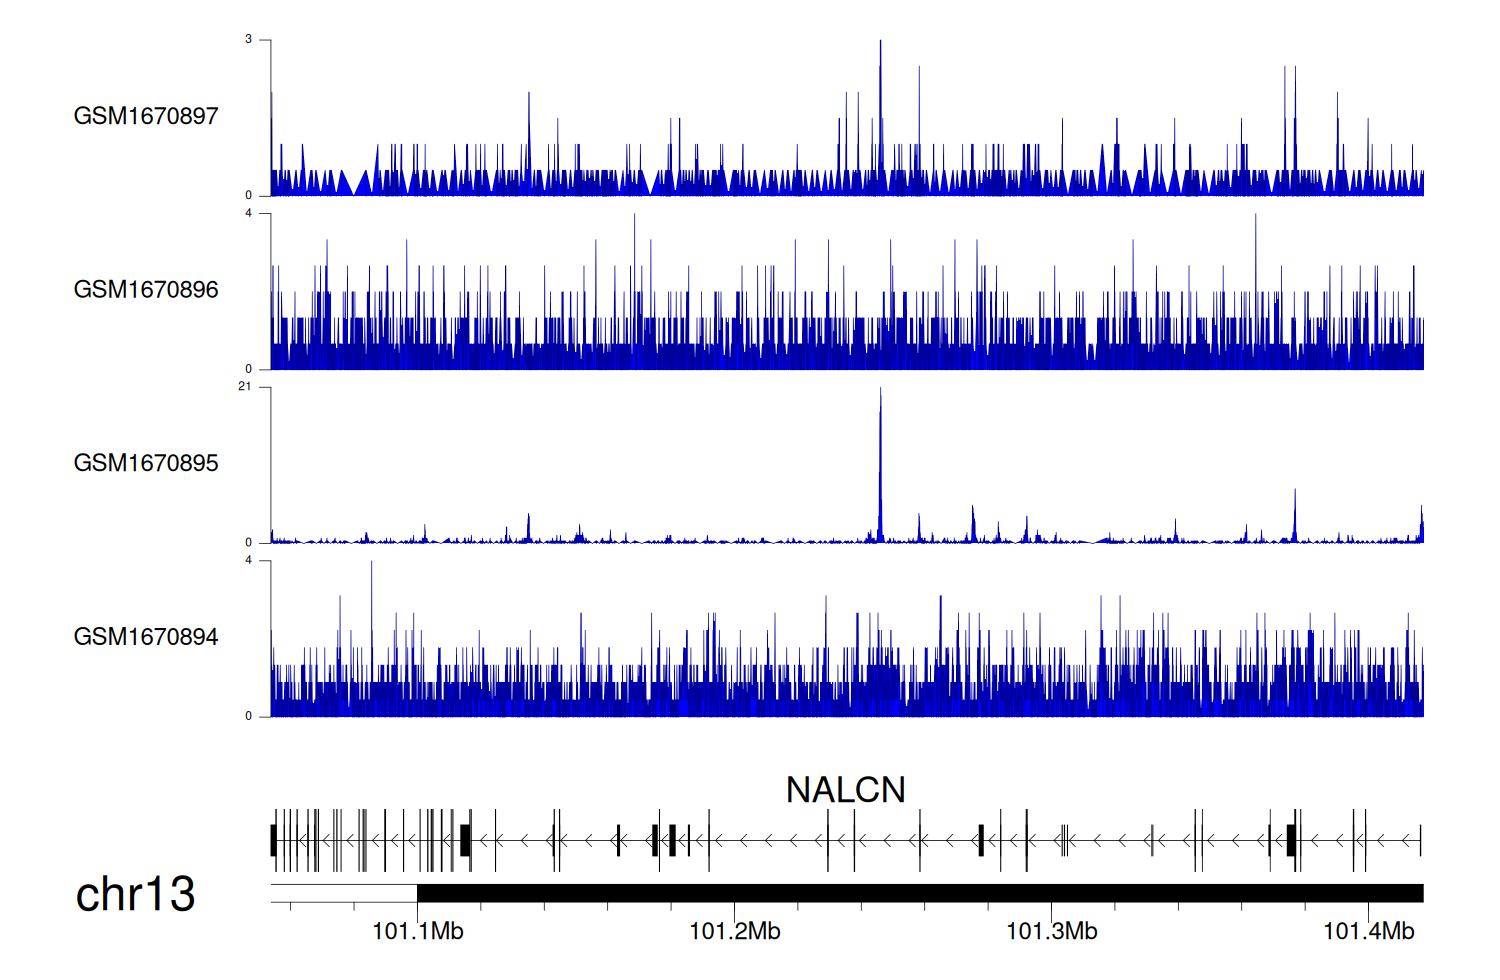
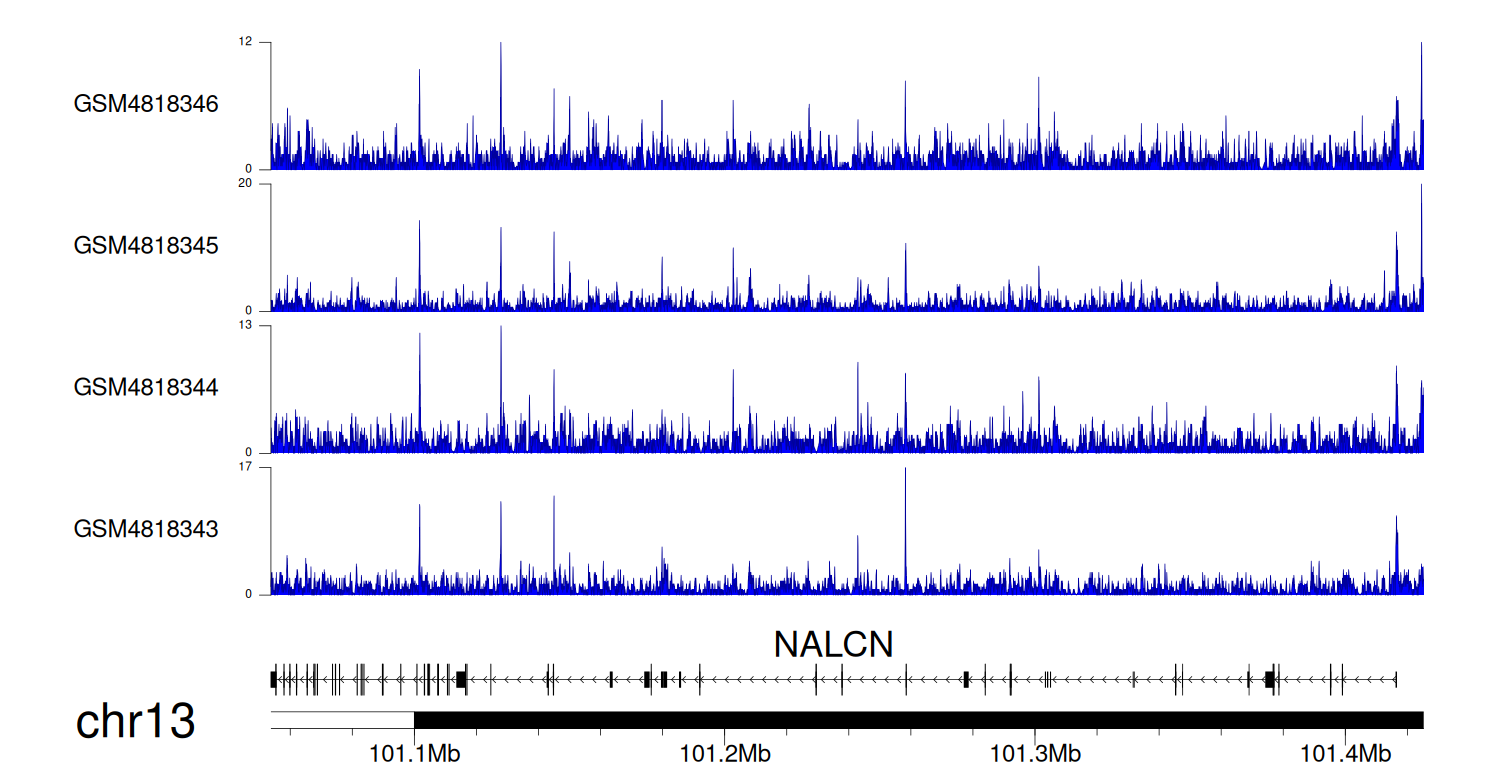
> Dataset: GSE68402 - NALCN peak across samples
|
Peak Plot
|
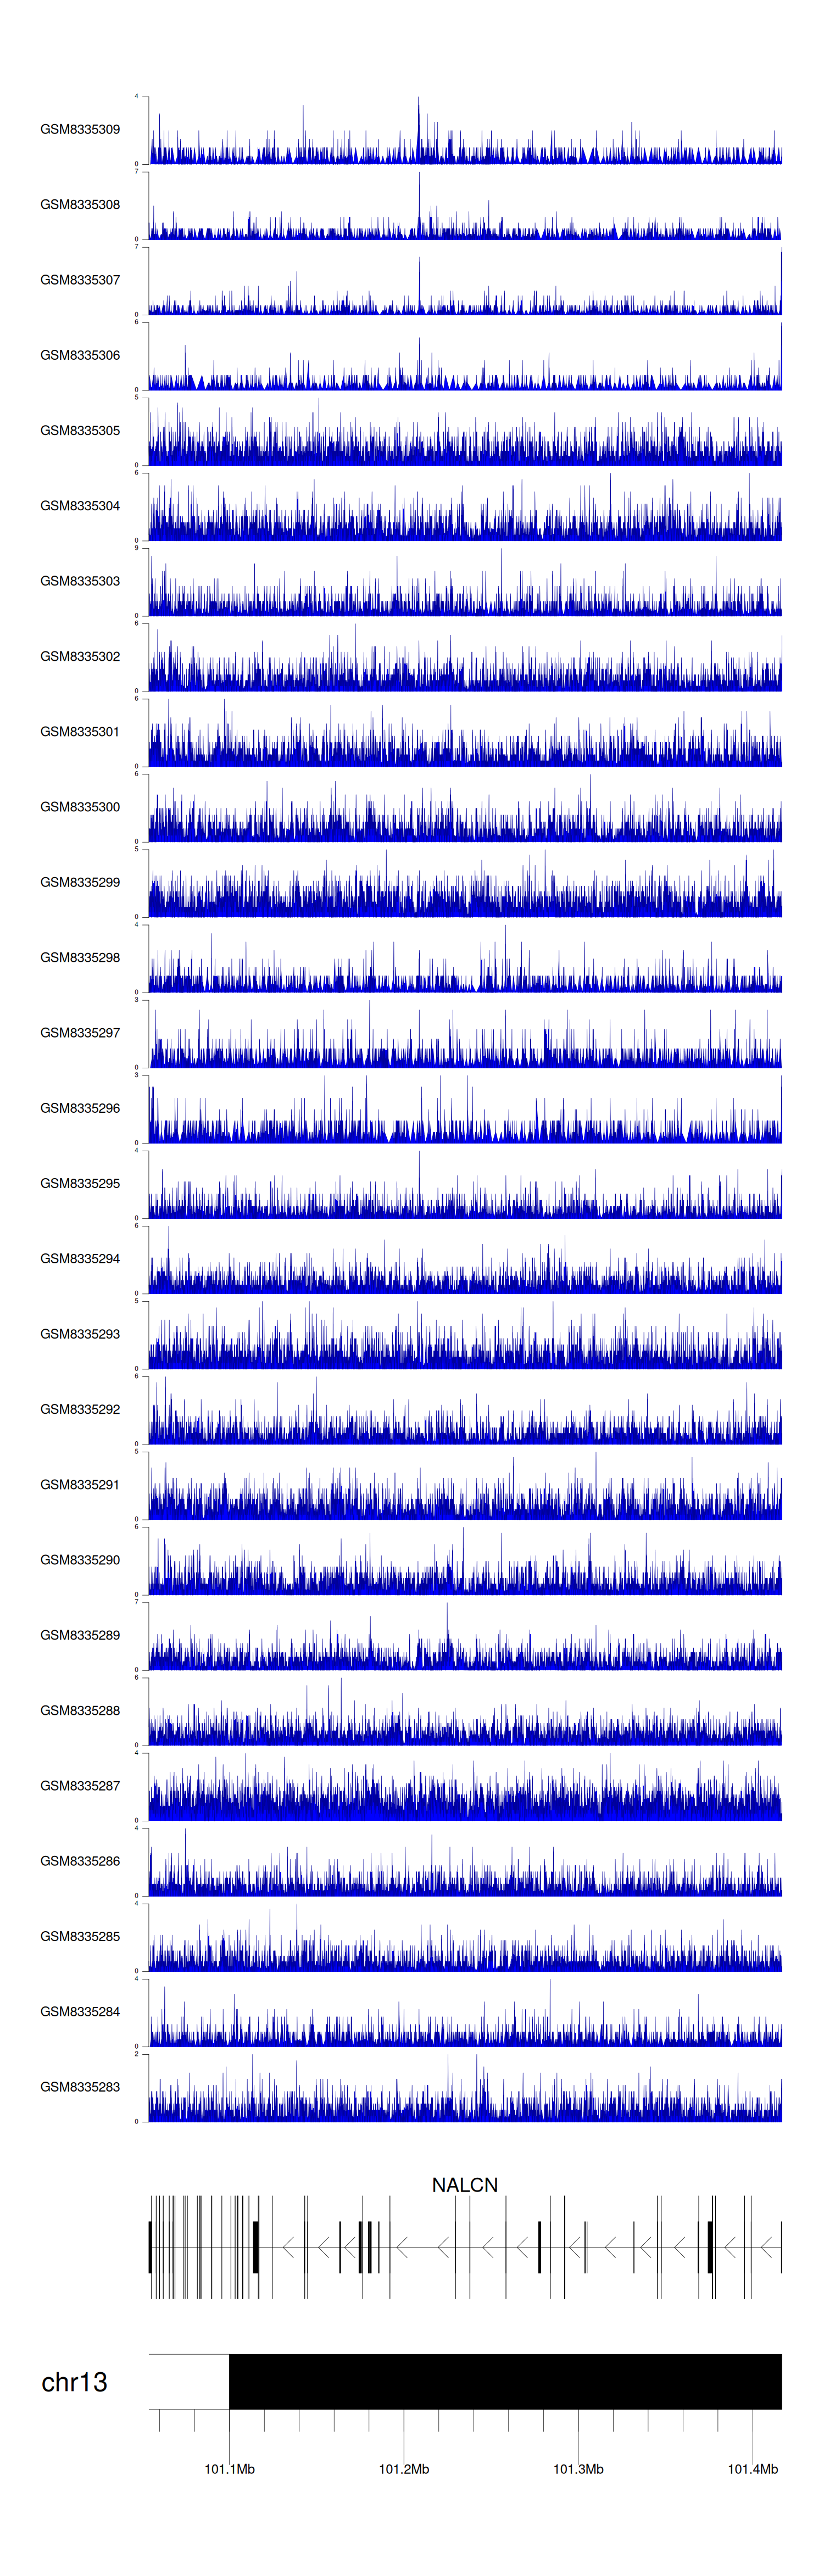
> Dataset: GSE270130 - NALCN peak across samples
|
Peak Plot
|
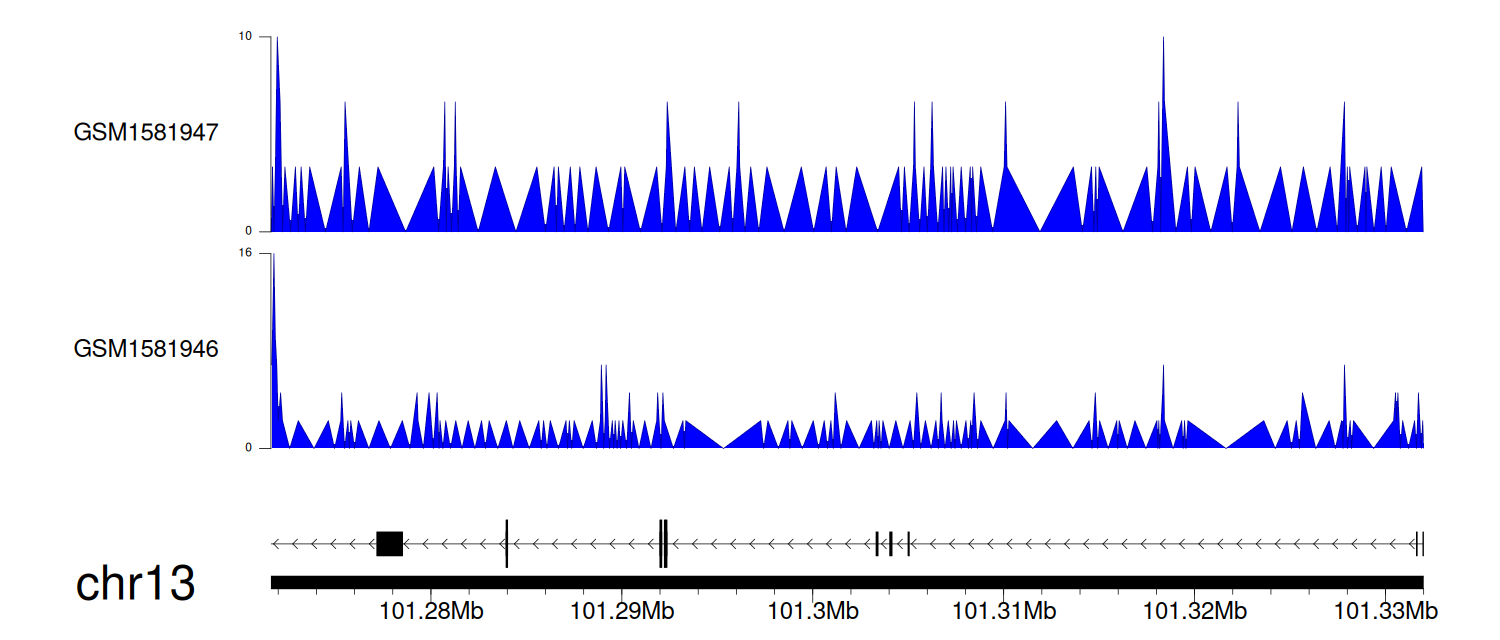
> Dataset: GSE64877 - NALCN peak across samples
|
Peak Plot
|
> Dataset: GSE131257 - NALCN peak across samples
|
Peak Plot
|
|
|
