Gene Information
|
Gene Name
|
NAV3 |
|
Gene ID
|
89795
|
|
Gene Full Name
|
neuron navigator 3 |
|
Gene Alias
|
POMFIL1|STEERIN3|unc53H3 |
|
Transcripts
|
ENSG00000067798
|
|
Virus
|
HTLV1 |
|
Gene Type
|
protein-coding |
|
HPA Location Info
|
Nuclear membrane;Cytosol; 
|
|
Membrane Info
|
Cancer-related genes, Disease related genes, Human disease related genes, Predicted intracellular proteins |
|
Uniport_ID
|
Q8IVL0
|
|
HGNC ID
|
HGNC:15998
|
|
OMIM ID
|
611629 |
|
Summary
|
This gene belongs to the neuron navigator family and is expressed predominantly in the nervous system. The encoded protein contains coiled-coil domains and a conserved AAA domain characteristic for ATPases associated with a variety of cellular activities. This gene is similar to unc-53, a Caenorhabditis elegans gene involved in axon guidance. Multiple alternatively spliced transcript variants for this gene have been described but only one has had its full-length nature determined. [provided by RefSeq, Jul 2008] |
Target gene [NAV3] related to VISs 
Integration Table: if previous studies reported that target gene was altered by virus integration events, the overlap between VISs in this literature and Cistrome factors was listed in this section
Target gene [NAV3] related to Omics data
| Data ID |
Experiment type |
Sample number |
Platform |
|
GSE189602
|
Methylation profiling (Array) |
4 |
Infinium MethylationEPIC |
|
C GSE94732
|
Chip-seq |
24 |
Illumina NextSeq 500 (Homo sapiens);illumina Genome Analyzer IIx (Homo sapiens) |
|
GSE52244
|
Expression array |
15 |
[HuEx-1_0-st] Affymetrix Human Exon 1.0 ST Array [probe set (exon) version] |
|
GSE10789
|
Expression array |
6 |
NCI/ATC Hs-OperonV3 |
|
GSE224047
|
RNA-seq |
10 |
Illumina NextSeq 500 (Homo sapiens) |
|
GSE168557
|
Expression array |
6 |
Agilent-039494 SurePrint G3 Human GE v2 8x60K Microarray 039381 (Feature Number version) |
|
M GSE136189
|
Methylation profiling (Array) |
40 |
Illumina HumanMethylation450 BeadChip (HumanMethylation450_15017482);Illumina Infinium HumanMethylation850 BeadChip |
When the query gene is differentially changed in the dataset, a volcano/bar plot will be displayed.
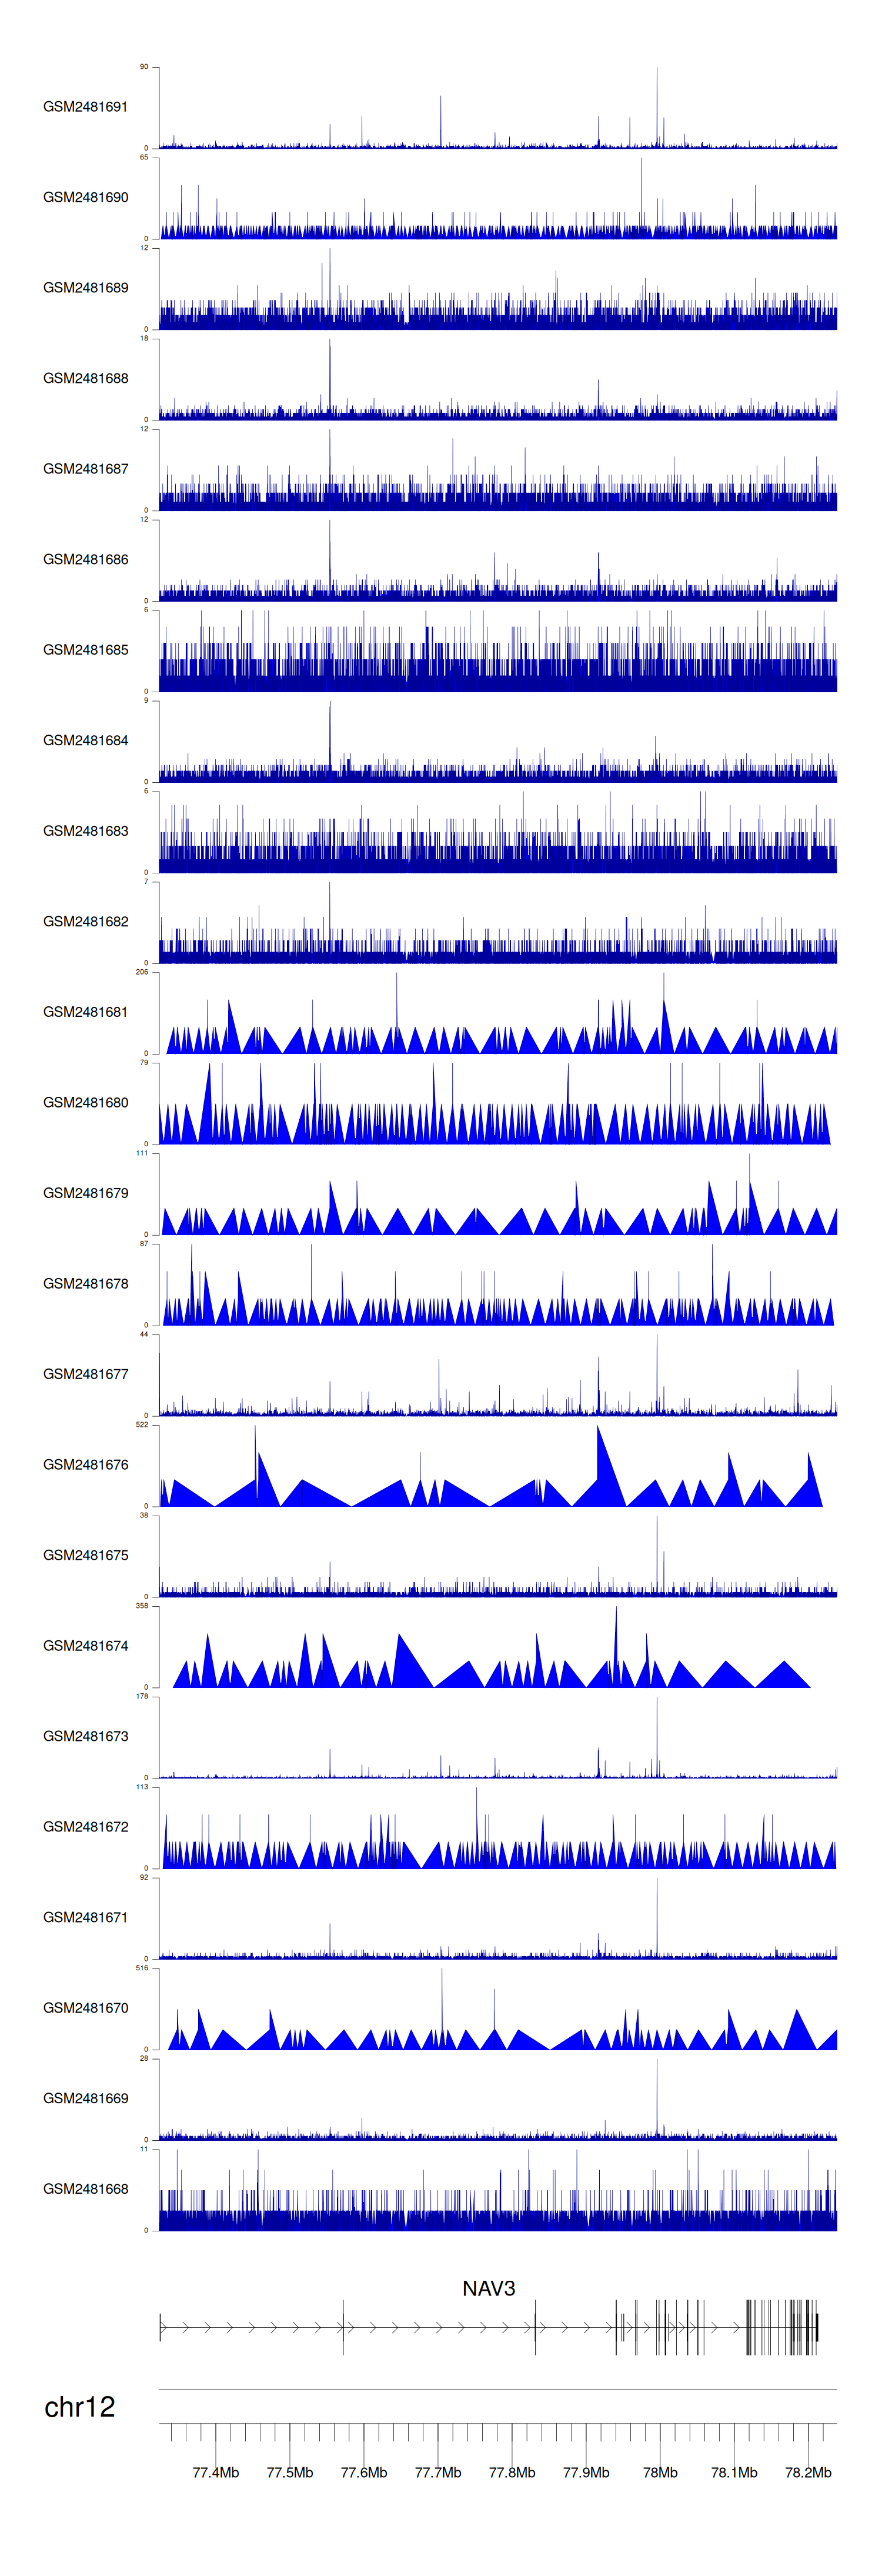
> Dataset: GSE94732 - NAV3 peak across samples
|
Peak Plot
|
|
|
