Gene Information
|
Gene Name
|
NHS |
|
Gene ID
|
4810
|
|
Gene Full Name
|
NHS actin remodeling regulator |
|
Gene Alias
|
CTRCT40|CXN|SCML1 |
|
Transcripts
|
ENSG00000188158
|
|
Virus
|
HTLV1 |
|
Gene Type
|
protein-coding |
|
HPA Location Info
|
Cell Junctions; 
|
|
Membrane Info
|
Disease related genes, Human disease related genes, Plasma proteins, Predicted intracellular proteins |
|
Uniport_ID
|
Q6T4R5
|
|
HGNC ID
|
HGNC:7820
|
|
OMIM ID
|
300457 |
|
Summary
|
This gene encodes a protein containing four conserved nuclear localization signals. The encoded protein functions in eye, tooth, craniofacial and brain development, and it can regulate actin remodeling and cell morphology. Mutations in this gene have been shown to cause Nance-Horan syndrome, and also X-linked cataract-40. Alternatively spliced transcript variants encoding different isoforms have been described for this gene. [provided by RefSeq, May 2014] |
Target gene [NHS] related to VISs 
Integration Table: if previous studies reported that target gene was altered by virus integration events, the overlap between VISs in this literature and Cistrome factors was listed in this section
| DVID |
Chromosome |
HM |
TFBS |
CA |
Sum of Overlapped Records |
Detail |
| 6001736 |
chrX |
6 |
27 |
323 |
356 |
View |
| 6010192 |
chrX |
0 |
4 |
28 |
32 |
View |
Target gene [NHS] related to Omics data
| Data ID |
Experiment type |
Sample number |
Platform |
|
GSE189602
|
Methylation profiling (Array) |
4 |
Infinium MethylationEPIC |
|
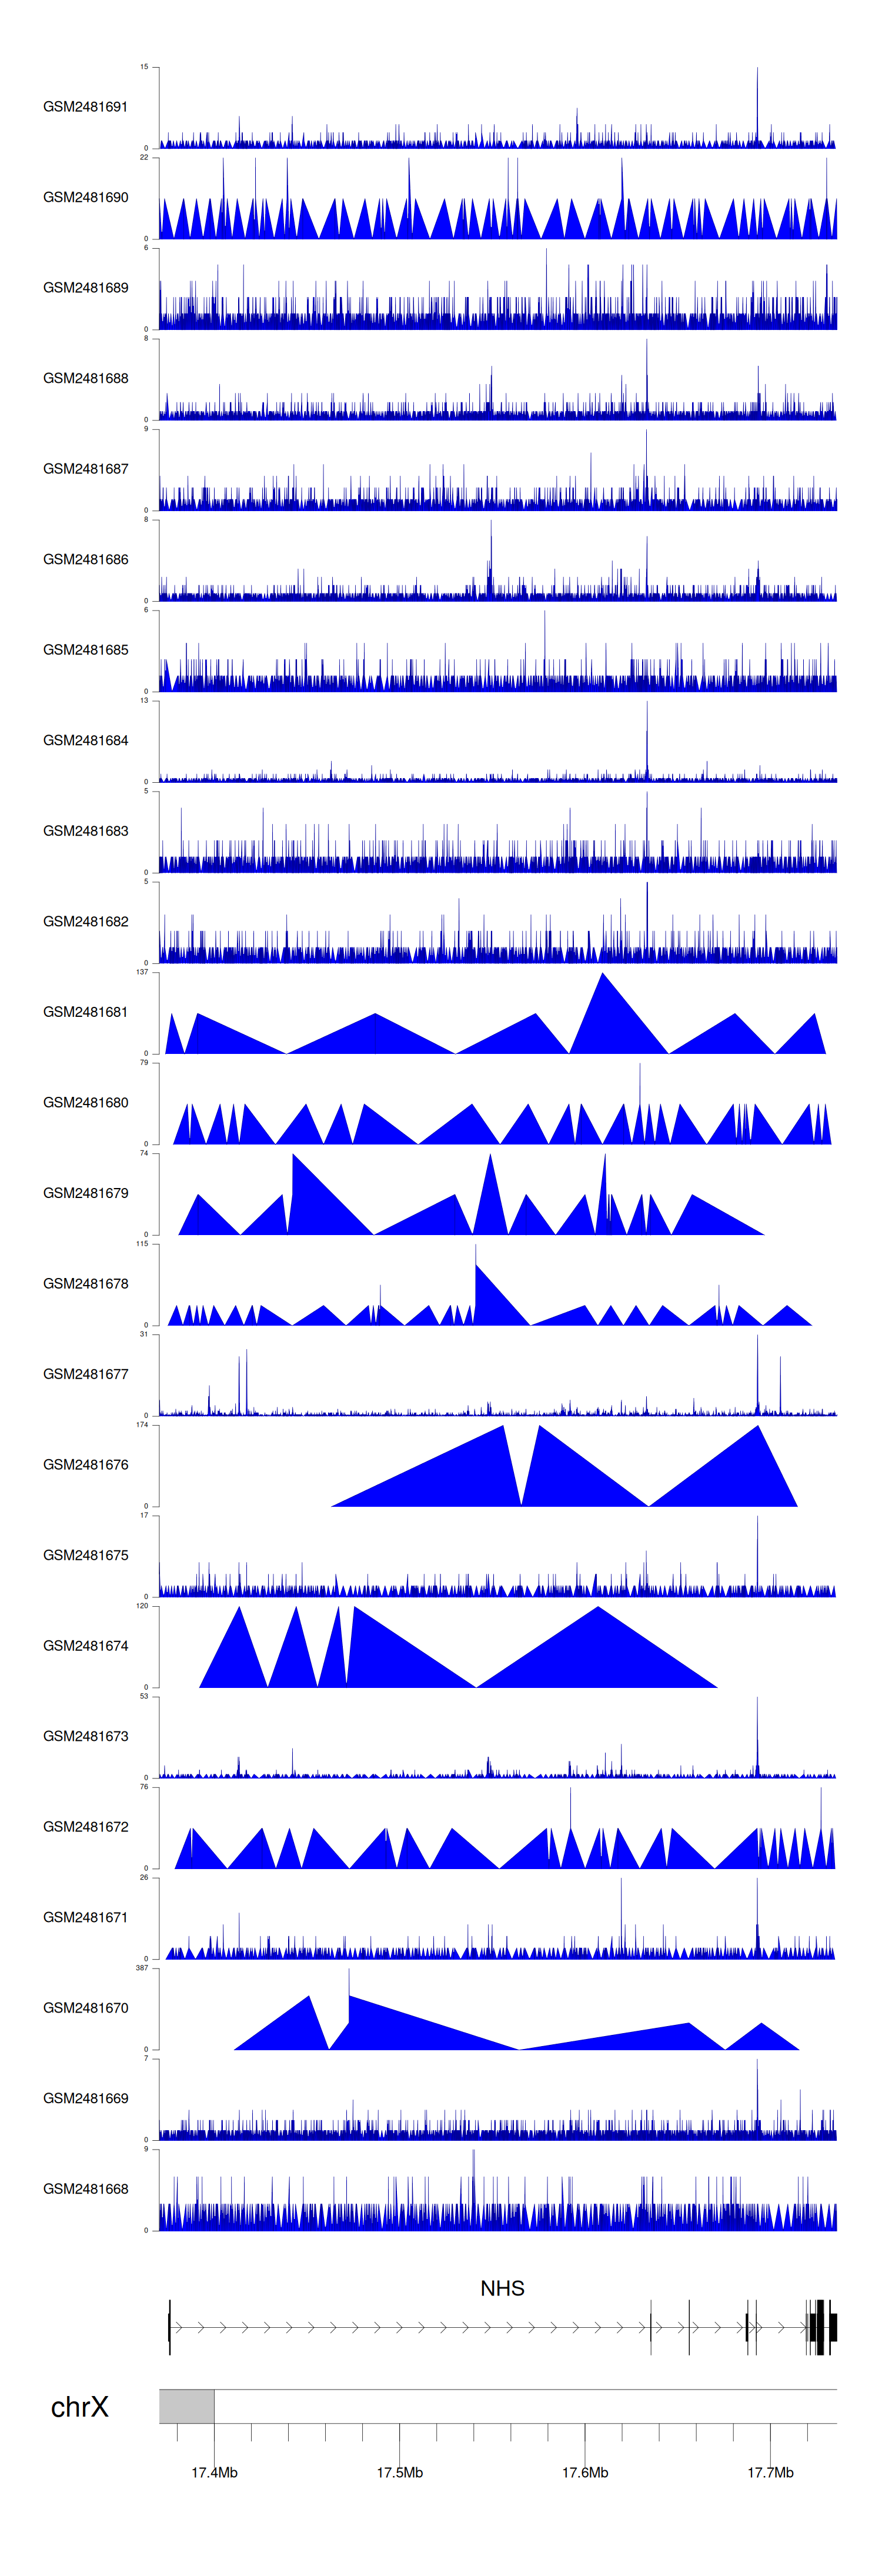
C GSE94732
|
Chip-seq |
24 |
Illumina NextSeq 500 (Homo sapiens);illumina Genome Analyzer IIx (Homo sapiens) |
|
GSE52244
|
Expression array |
15 |
[HuEx-1_0-st] Affymetrix Human Exon 1.0 ST Array [probe set (exon) version] |
|
GSE10789
|
Expression array |
6 |
NCI/ATC Hs-OperonV3 |
|
GSE224047
|
RNA-seq |
10 |
Illumina NextSeq 500 (Homo sapiens) |
|
GSE168557
|
Expression array |
6 |
Agilent-039494 SurePrint G3 Human GE v2 8x60K Microarray 039381 (Feature Number version) |
|
GSE136189
|
Methylation profiling (Array) |
40 |
Illumina HumanMethylation450 BeadChip (HumanMethylation450_15017482);Illumina Infinium HumanMethylation850 BeadChip |
When the gene can detect a peak in the dataset, a peak plot will be displayed.
> Dataset: GSE94732 - NHS peak across samples
|
Peak Plot
|
|
|
