Gene Information
|
Gene Name
|
OPA1 |
|
Gene ID
|
4976
|
|
Gene Full Name
|
OPA1 mitochondrial dynamin like GTPase |
|
Gene Alias
|
BERHS|MGM1|MTDPS14|NPG|NTG|largeG |
|
Transcripts
|
ENSG00000198836
|
|
Virus
|
HBV |
|
Gene Type
|
protein-coding |
|
HPA Location Info
|
Nucleoplasm, Mitochondria; 
|
|
Membrane Info
|
Disease related genes, Enzymes, Human disease related genes, Plasma proteins, Potential drug targets, Predicted intracellular proteins, Transporters |
|
Uniport_ID
|
O60313
|
|
HGNC ID
|
HGNC:8140
|
|
OMIM ID
|
605290 |
|
Summary
|
The protein encoded by this gene is a nuclear-encoded mitochondrial protein with similarity to dynamin-related GTPases. The encoded protein localizes to the inner mitochondrial membrane and helps regulate mitochondrial stability and energy output. This protein also sequesters cytochrome c. Mutations in this gene have been associated with optic atrophy type 1, which is a dominantly inherited optic neuropathy resulting in progressive loss of visual acuity, leading in many cases to legal blindness. [provided by RefSeq, Aug 2017] |
Target gene [OPA1] related to VISs 
Integration Table: if previous studies reported that target gene was altered by virus integration events, the overlap between VISs in this literature and Cistrome factors was listed in this section
| DVID |
Chromosome |
HM |
TFBS |
CA |
Sum of Overlapped Records |
Detail |
| 1006223 |
chr3 |
34 |
7 |
0 |
41 |
View |
| 1007100 |
chr3 |
25 |
5 |
0 |
30 |
View |
Target gene [OPA1] related to Omics data
| Data ID |
Experiment type |
Sample number |
Platform |
|
GSE236281
|
RNA-seq |
12 |
Illumina MiSeq (Homo sapiens) |
|
C GSE35465
|
Chip-seq;RNA-seq |
6 |
Illumina HiSeq 2000 (Homo sapiens) |
|
C GSE68402
|
Chip-seq |
26 |
Illumina MiSeq (Homo sapiens);Illumina HiSeq 2500 (Homo sapiens) |
|
GSE247322
|
scRNA-seq |
27 |
Illumina NovaSeq 6000 (Homo sapiens) |
|
TCGA_LIHC_HBV
|
DNA methylation sequencing;RNA-seq |
97 |
TCGA |
|
C GSE270130
|
Chip-seq |
27 |
Illumina NovaSeq 6000 (Homo sapiens) |
|
GSE224901
|
RNA-seq |
21 |
Illumina NovaSeq 6000 (Homo sapiens) |
|
C GSE100400
|
Chip-seq;RNA-seq;4C_cccDNA |
31 |
Illumina NextSeq 500 (Homo sapiens);Illumina NextSeq 500 (Mus musculus) |
|
GSE173897
|
RNA-seq |
95 |
Illumina HiSeq 4000 (Homo sapiens) |
|
GSE262515
|
RNA-seq |
21 |
Illumina HiSeq 2500 (Homo sapiens);Illumina HiSeq 2500 (Mus musculus) |
|
GSE110345
|
RNA-seq |
4 |
Illumina HiSeq 2500 (Homo sapiens) |
|
C GSE131257
|
ATAC-seq;RNA-seq |
19 |
Illumina HiSeq 2500 (Homo sapiens) |
|
GSE94660
|
RNA-seq |
42 |
Illumina HiSeq 2500 (Homo sapiens) |
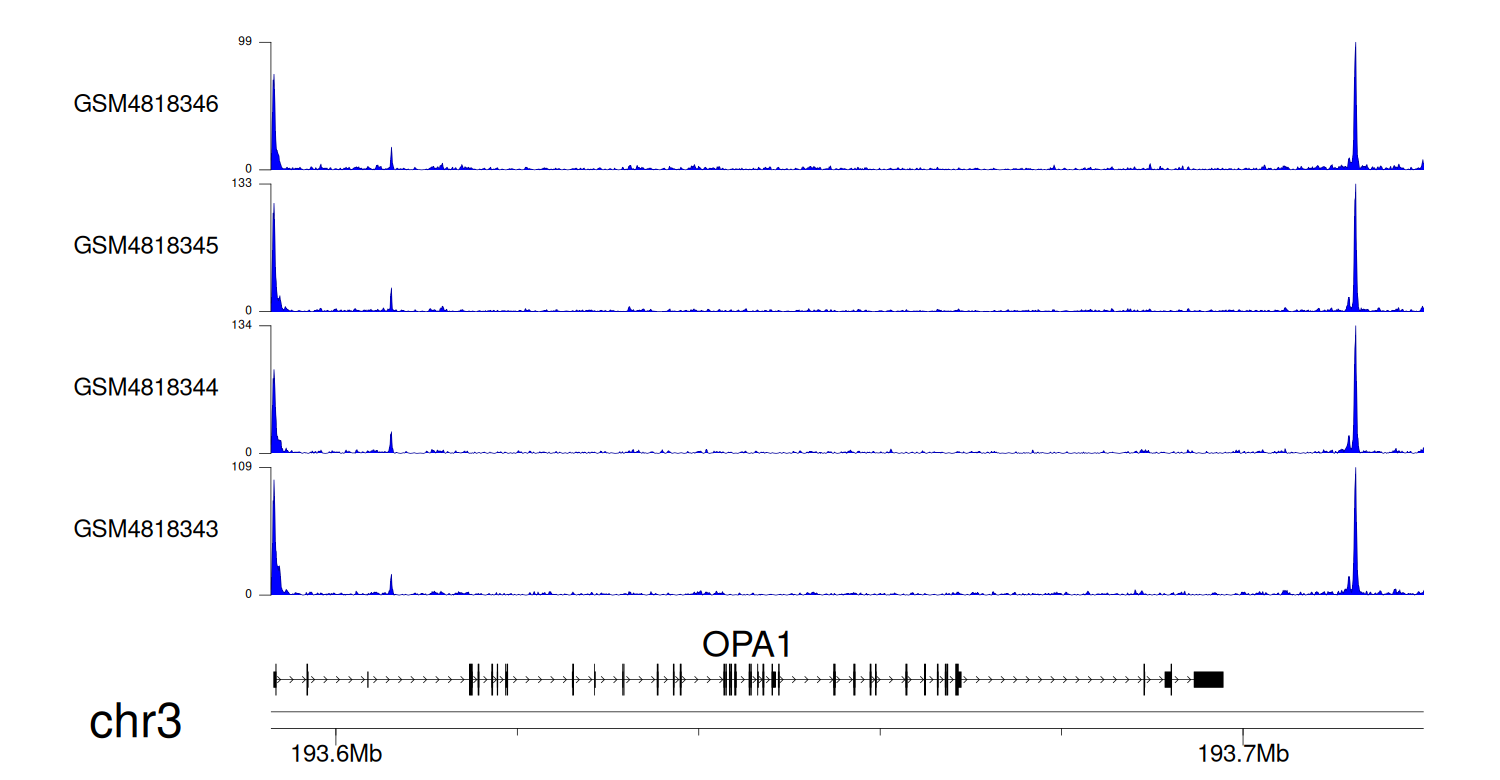
When the gene can detect a peak in the dataset, a peak plot will be displayed.
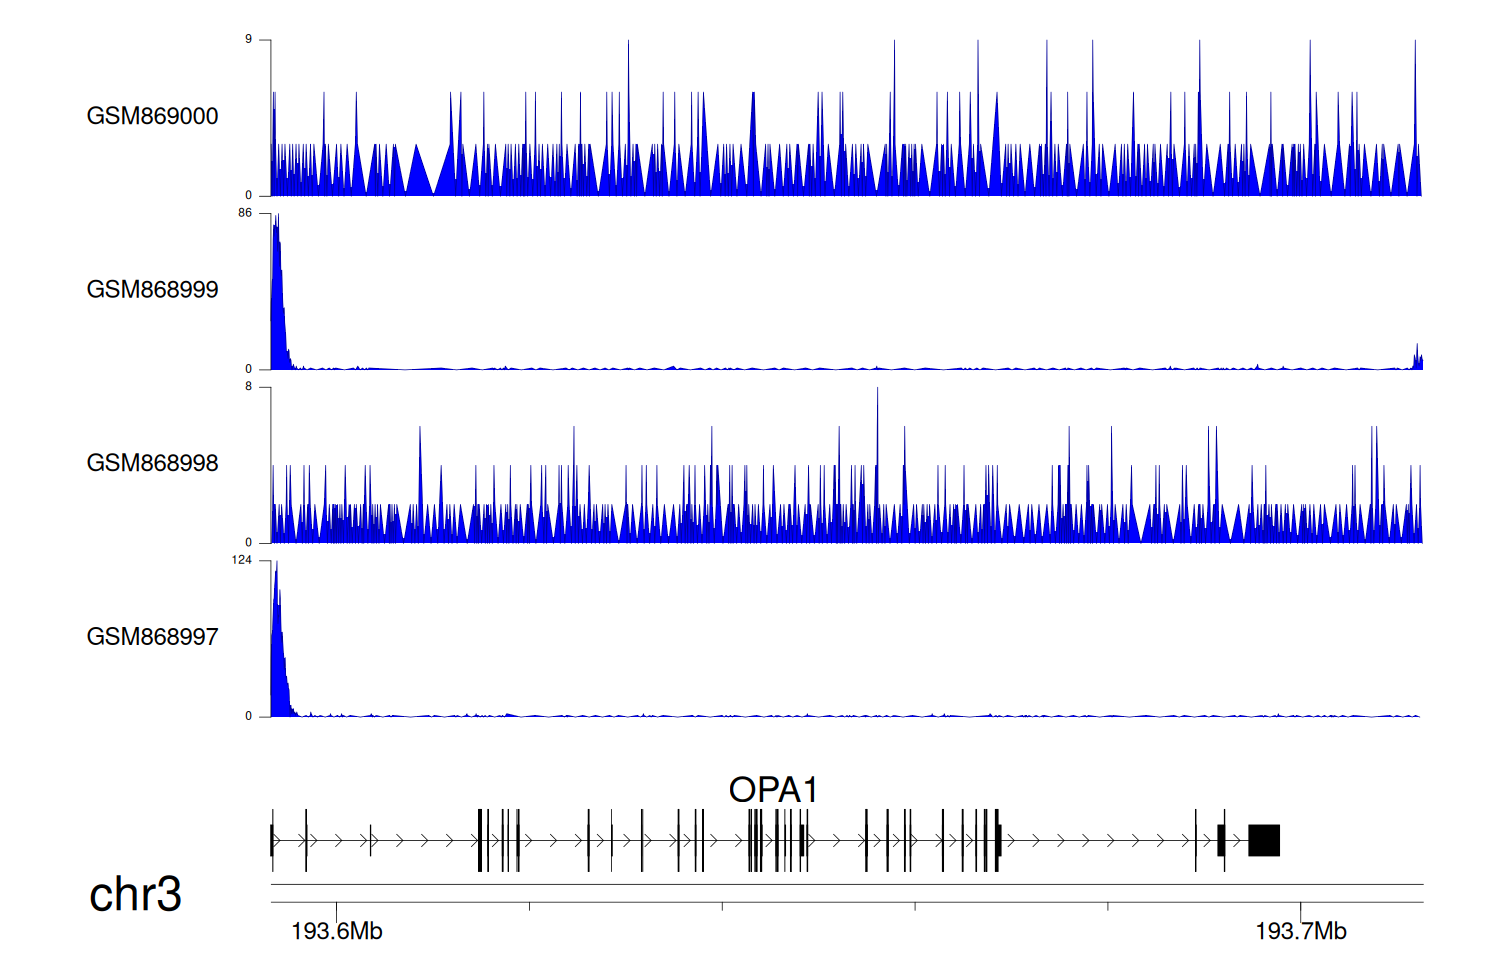
> Dataset: GSE35465 - OPA1 peak across samples
|
Peak Plot
|
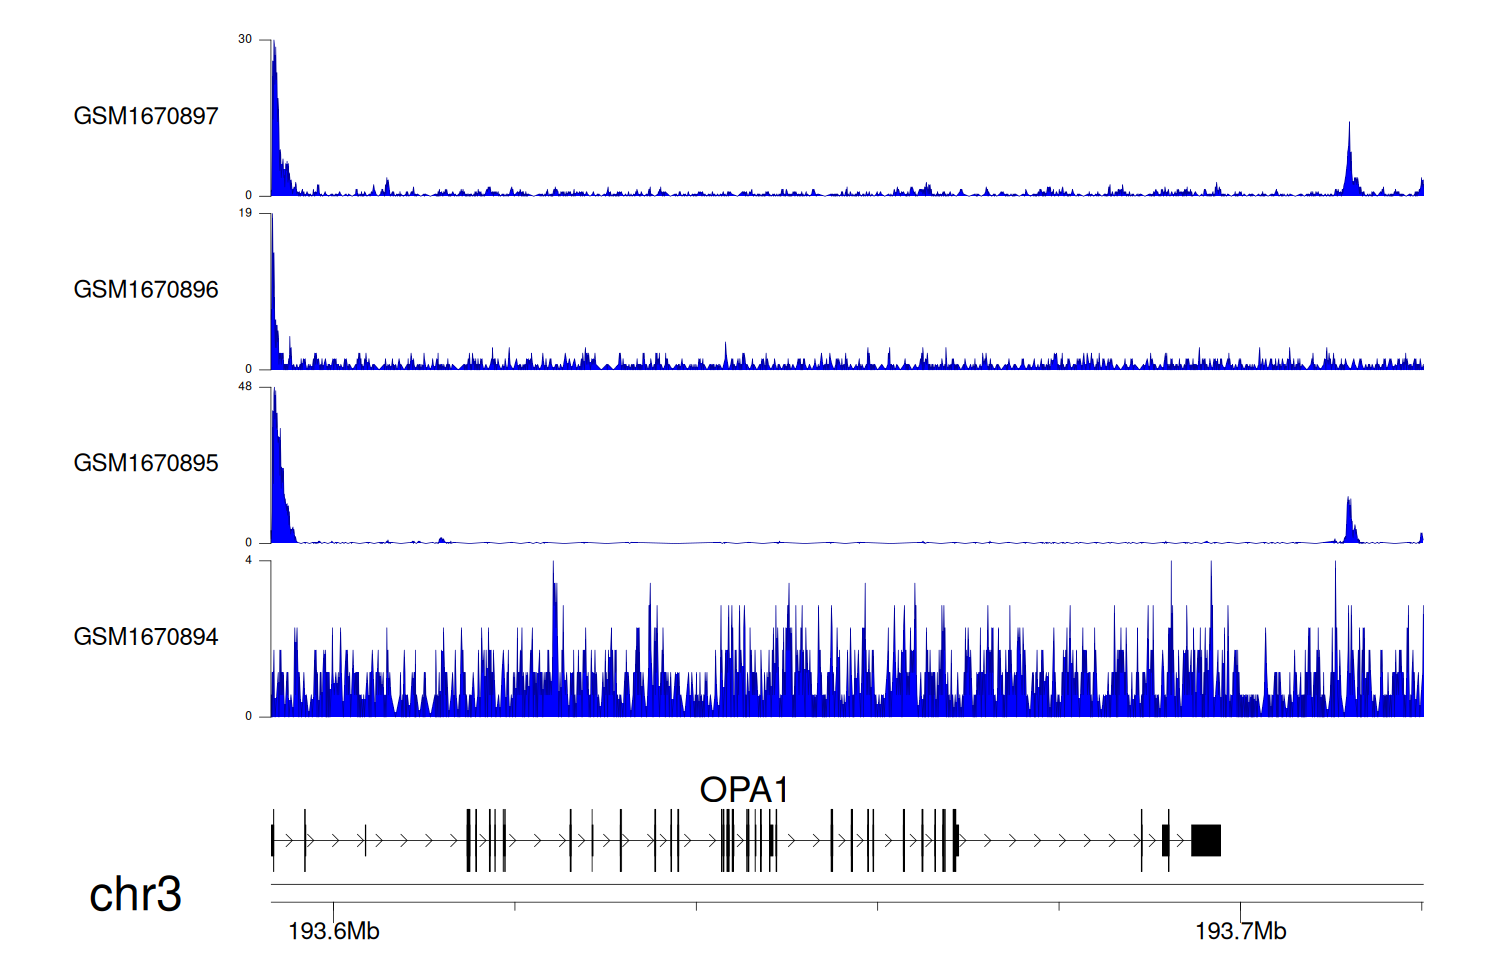
> Dataset: GSE68402 - OPA1 peak across samples
|
Peak Plot
|
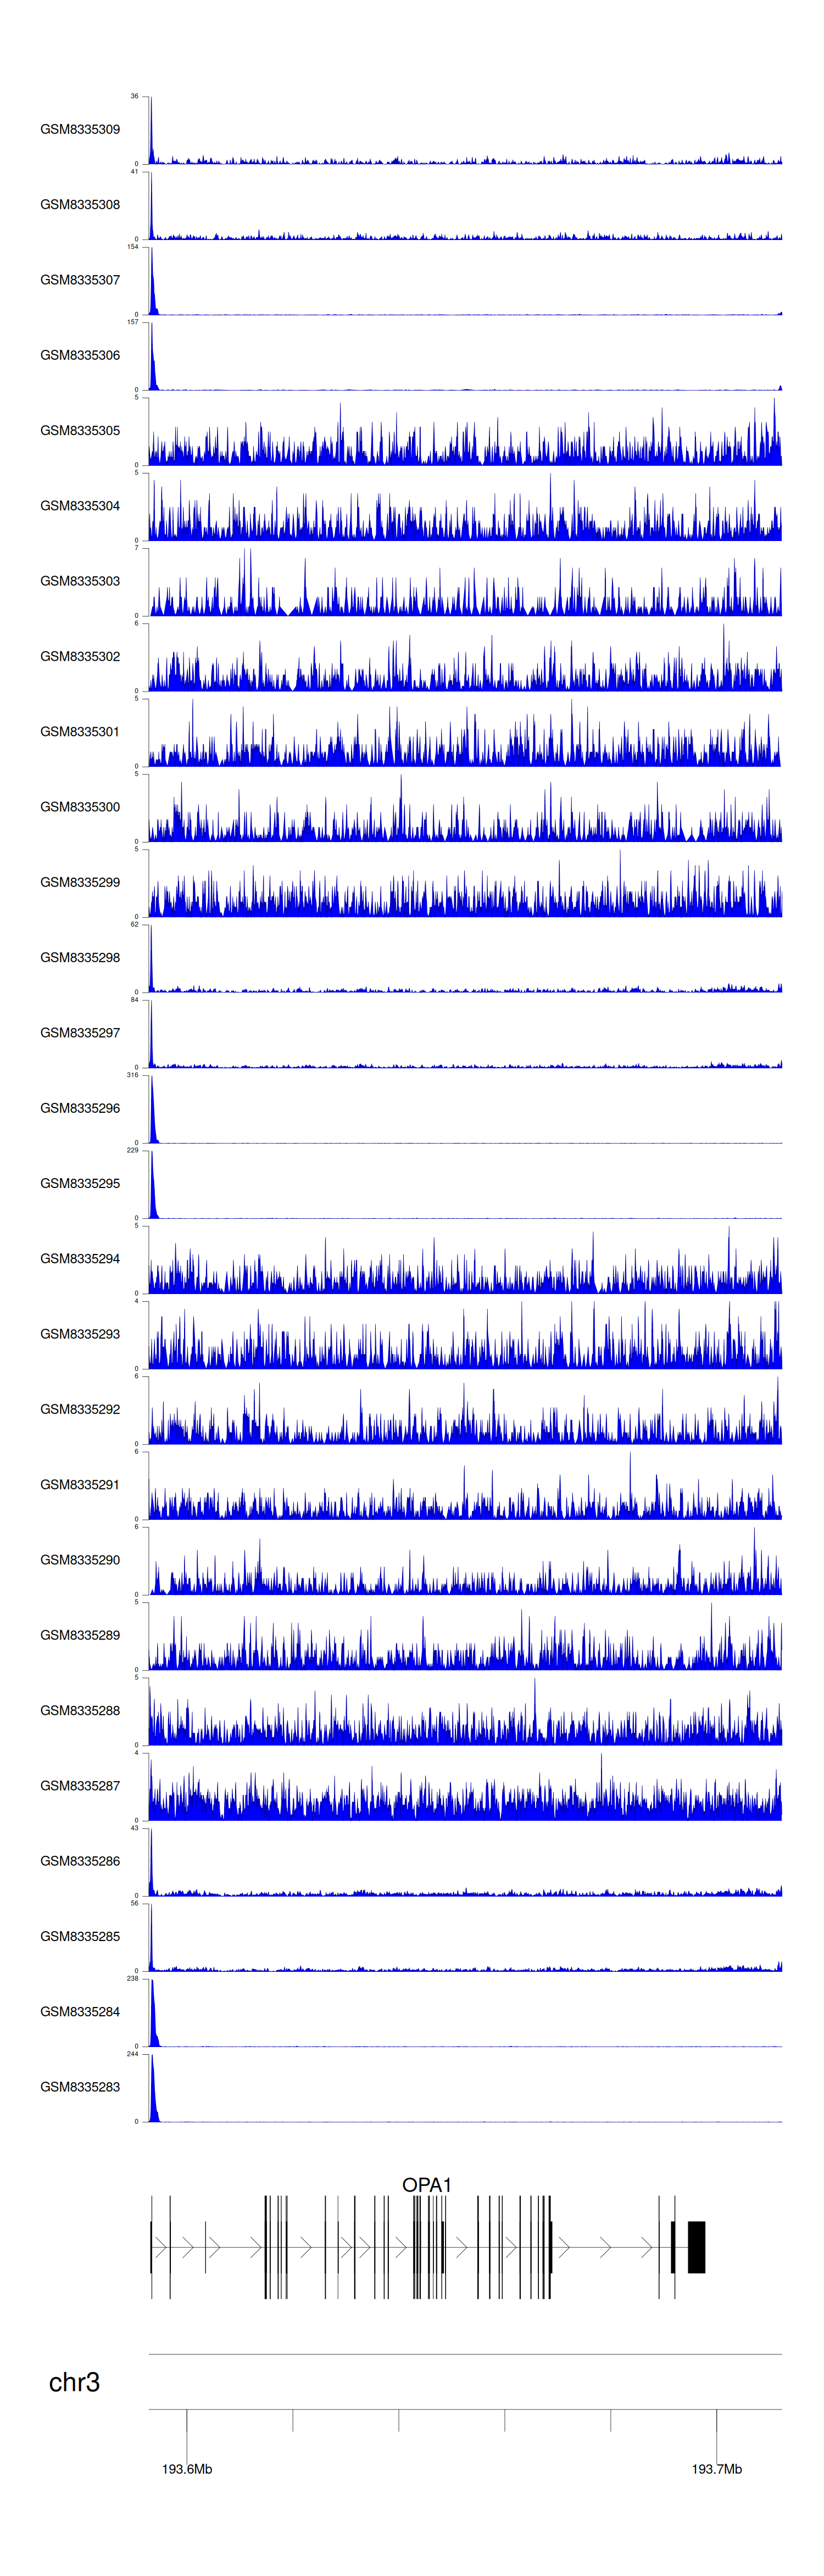
> Dataset: GSE270130 - OPA1 peak across samples
|
Peak Plot
|
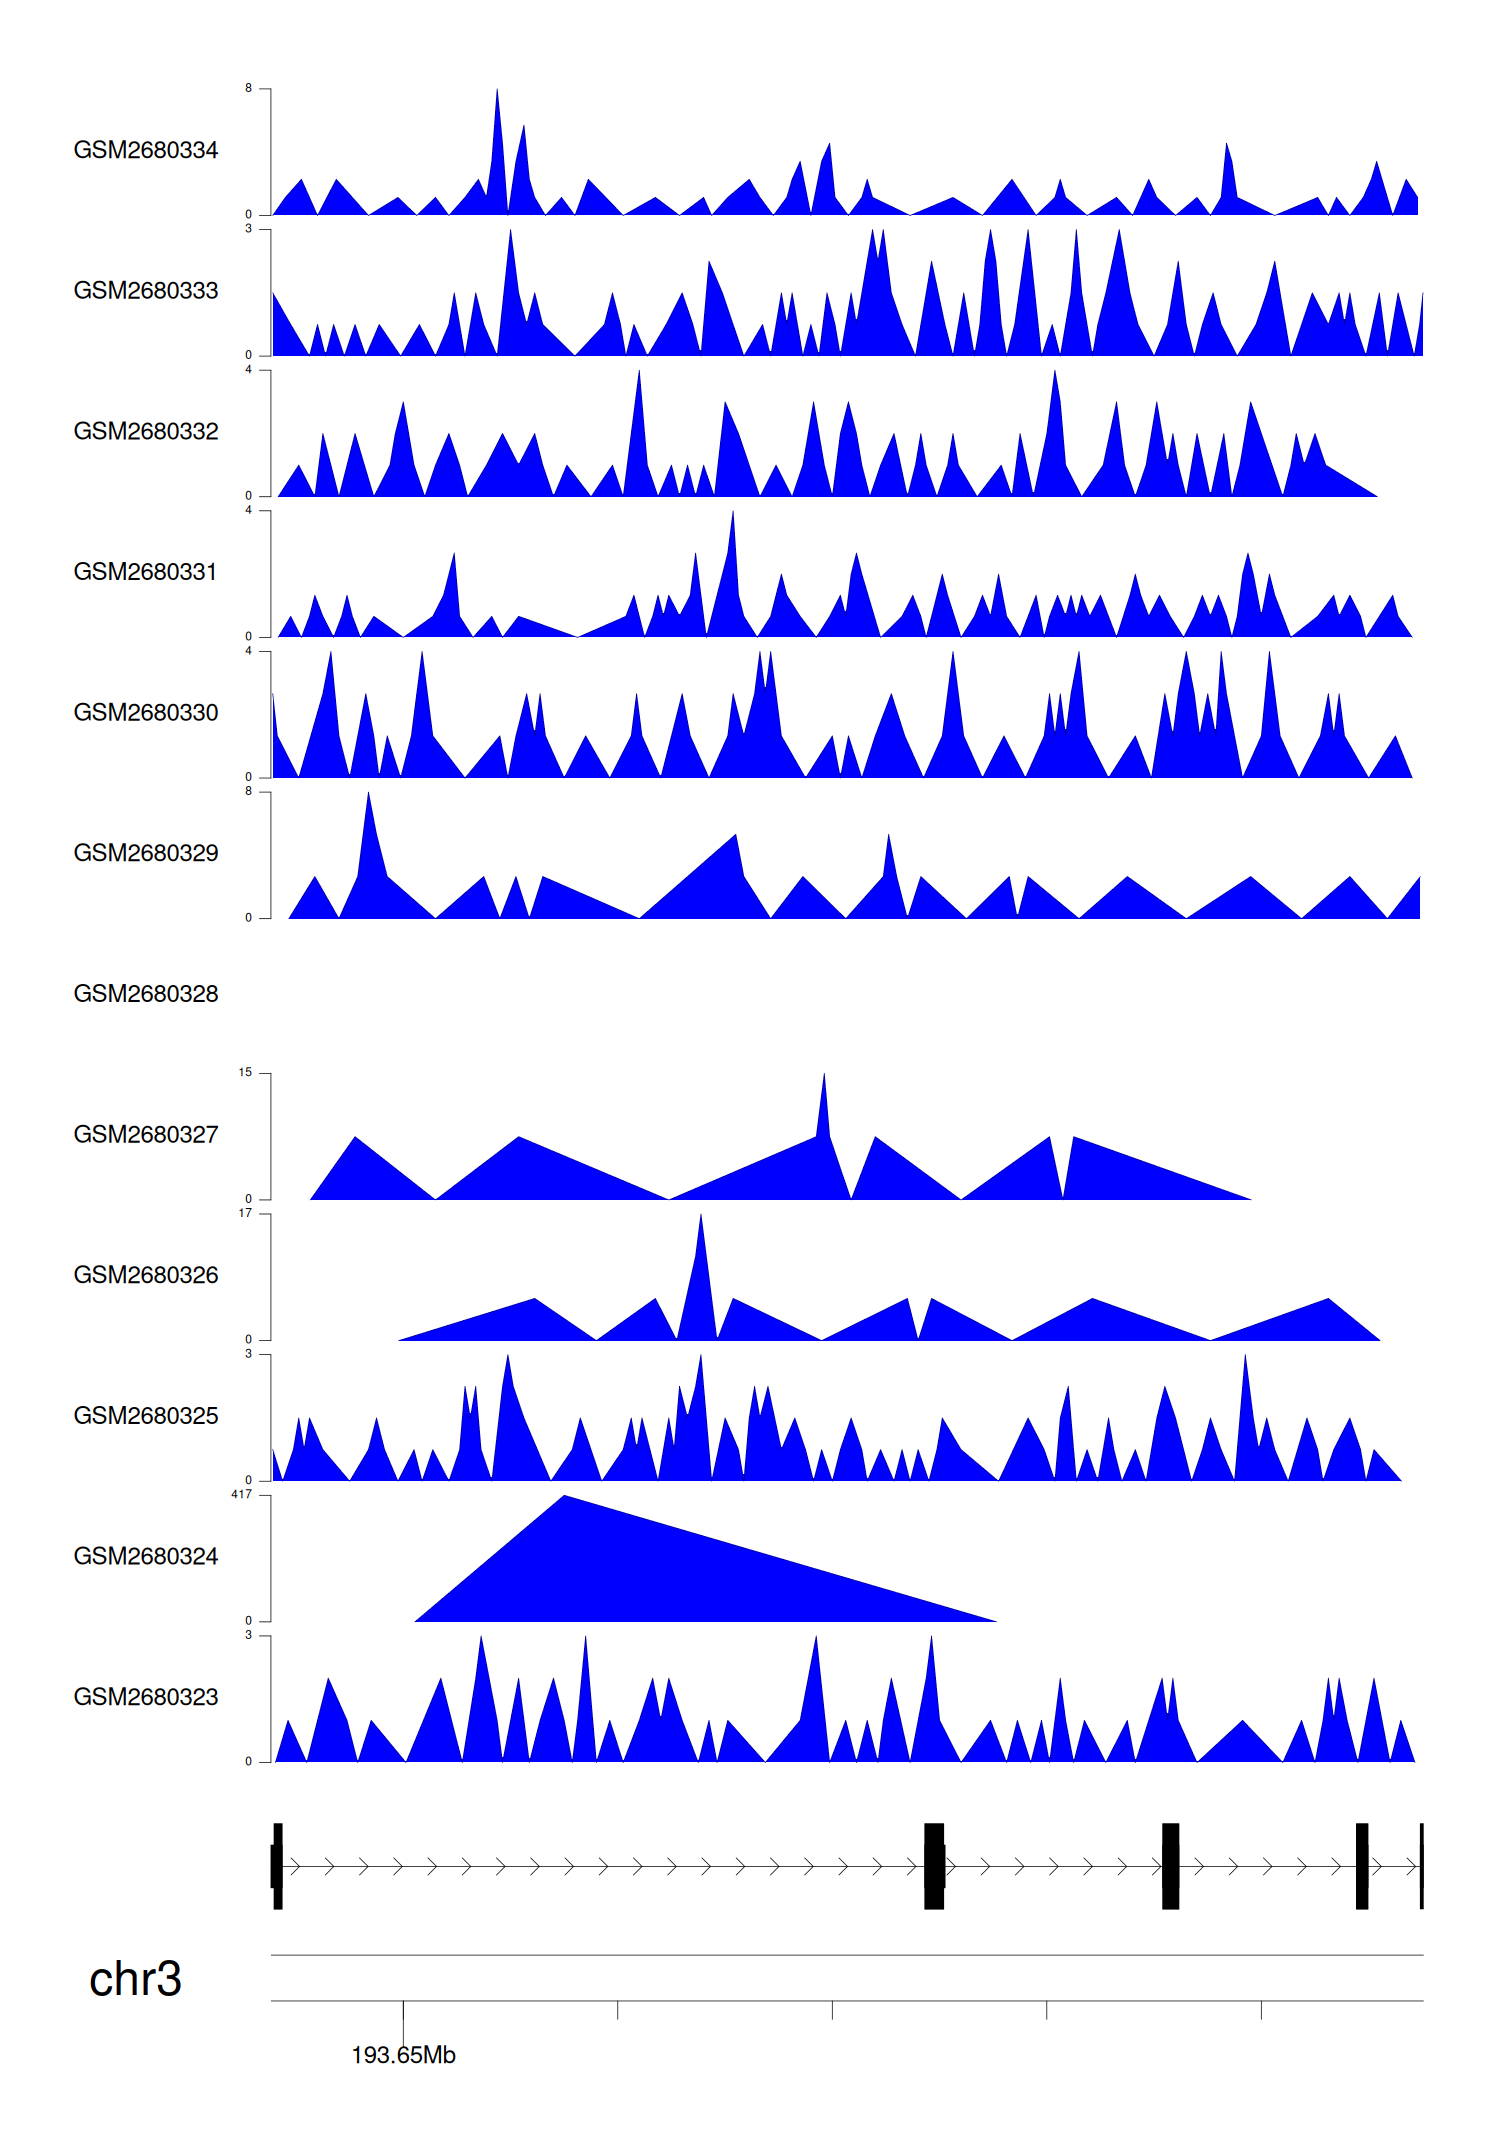
> Dataset: GSE100400 - OPA1 peak across samples
|
Peak Plot
|
> Dataset: GSE131257 - OPA1 peak across samples
|
Peak Plot
|
|
|
