Gene Information
|
Gene Name
|
P3H2 |
|
Gene ID
|
55214
|
|
Gene Full Name
|
prolyl 3-hydroxylase 2 |
|
Gene Alias
|
LEPREL1|MCVD|MLAT4 |
|
Transcripts
|
ENSG00000090530
|
|
Virus
|
HTLV1 |
|
Gene Type
|
protein-coding |
|
HPA Location Info
|
Golgi apparatus;Nucleoplasm, Vesicles, Cytosol;Intracellular and membrane; 
|
|
Membrane Info
|
Disease related genes, Enzymes, Human disease related genes, Potential drug targets, Predicted intracellular proteins |
|
Uniport_ID
|
Q8IVL5
|
|
HGNC ID
|
HGNC:19317
|
|
OMIM ID
|
610341 |
|
Summary
|
This gene encodes a member of the prolyl 3-hydroxylase subfamily of 2-oxo-glutarate-dependent dioxygenases. These enzymes play a critical role in collagen chain assembly, stability and cross-linking by catalyzing post-translational 3-hydroxylation of proline residues. Mutations in this gene are associated with nonsyndromic severe myopia with cataract and vitreoretinal degeneration, and downregulation of this gene may play a role in breast cancer. Alternatively spliced transcript variants encoding multiple isoforms have been observed for this gene. [provided by RefSeq, Dec 2011] |
Target gene [P3H2] related to VISs 
Integration Table: if previous studies reported that target gene was altered by virus integration events, the overlap between VISs in this literature and Cistrome factors was listed in this section
| DVID |
Chromosome |
HM |
TFBS |
CA |
Sum of Overlapped Records |
Detail |
| 6004909 |
chr3 |
79 |
14 |
8 |
101 |
View |
Target gene [P3H2] related to Omics data
| Data ID |
Experiment type |
Sample number |
Platform |
|
C GSE94732
|
Chip-seq |
24 |
Illumina NextSeq 500 (Homo sapiens);illumina Genome Analyzer IIx (Homo sapiens) |
|
GSE52244
|
Expression array |
15 |
[HuEx-1_0-st] Affymetrix Human Exon 1.0 ST Array [probe set (exon) version] |
|
GSE10789
|
Expression array |
6 |
NCI/ATC Hs-OperonV3 |
|
GSE224047
|
RNA-seq |
10 |
Illumina NextSeq 500 (Homo sapiens) |
|
GSE189602
|
Methylation profiling (Array) |
4 |
Infinium MethylationEPIC |
When the gene can detect a peak in the dataset, a peak plot will be displayed.
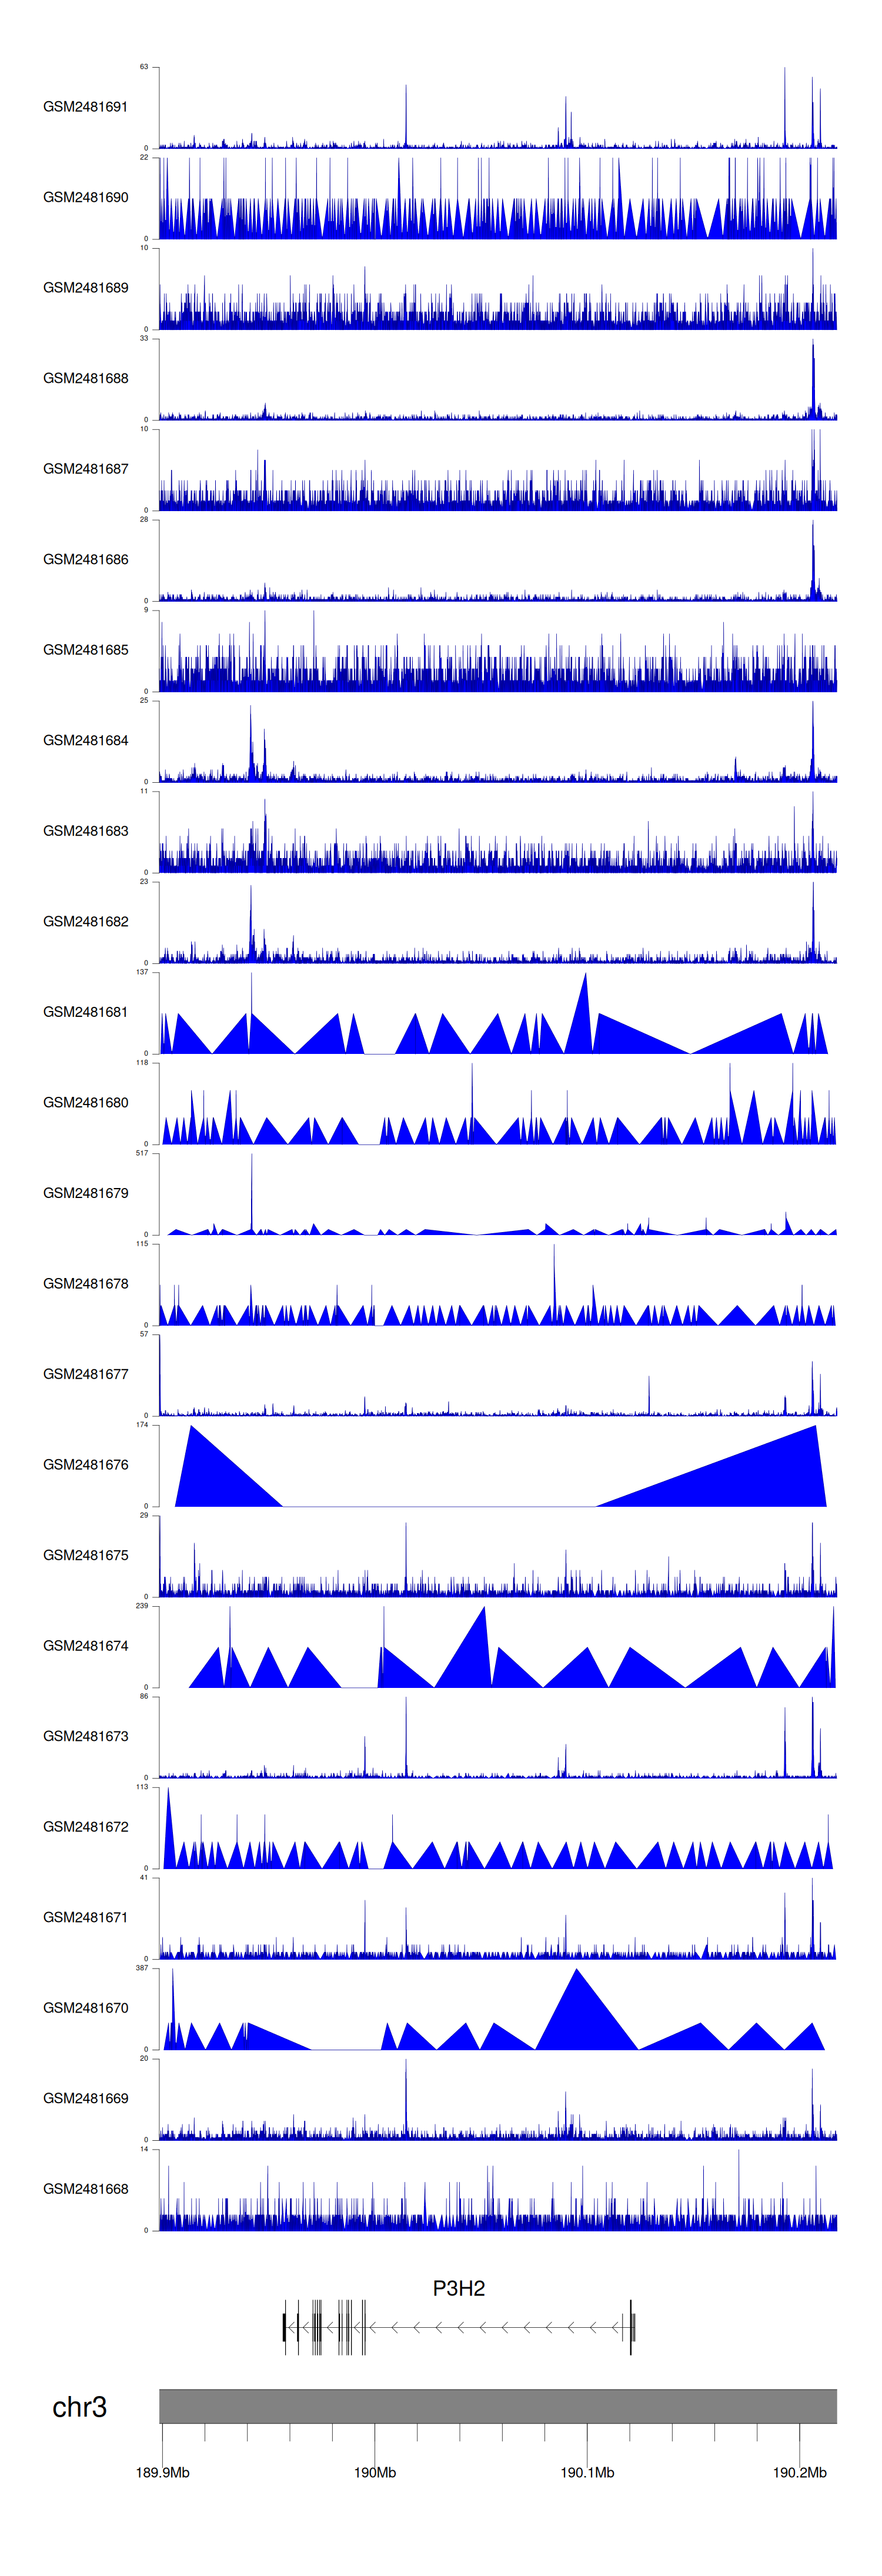
> Dataset: GSE94732 - P3H2 peak across samples
|
Peak Plot
|
|
|
