Gene Information
|
Gene Name
|
PDE10A |
|
Gene ID
|
10846
|
|
Gene Full Name
|
phosphodiesterase 10A |
|
Gene Alias
|
ADSD2|HSPDE10A|IOLOD|LINC00473|PDE10A19 |
|
Transcripts
|
ENSG00000112541
|
|
Virus
|
HTLV1 |
|
Gene Type
|
protein-coding |
|
HPA Location Info
|

|
|
Membrane Info
|
Disease related genes, Enzymes, FDA approved drug targets, Human disease related genes, Metabolic proteins, Predicted intracellular proteins |
|
Uniport_ID
|
Q9Y233
|
|
HGNC ID
|
HGNC:8772
|
|
OMIM ID
|
610652 |
|
Summary
|
The protein encoded by this gene belongs to the cyclic nucleotide phosphodiesterase family. It plays a role in signal transduction by regulating the intracellular concentration of cyclic nucleotides. This protein can hydrolyze both cAMP and cGMP to the corresponding nucleoside 5' monophosphate, but has higher affinity for cAMP, and is more efficient with cAMP as substrate. Alternatively spliced transcript variants have been described for this gene. [provided by RefSeq, Dec 2011] |
Target gene [PDE10A] related to VISs 
Integration Table: if previous studies reported that target gene was altered by virus integration events, the overlap between VISs in this literature and Cistrome factors was listed in this section
| DVID |
Chromosome |
HM |
TFBS |
CA |
Sum of Overlapped Records |
Detail |
| 6005497 |
chr6 |
51 |
15 |
20 |
86 |
View |
| 6011281 |
chr6 |
19 |
7 |
1 |
27 |
View |
| 6032006 |
chr6 |
0 |
0 |
0 |
0 |
View |
Target gene [PDE10A] related to Omics data
| Data ID |
Experiment type |
Sample number |
Platform |
|
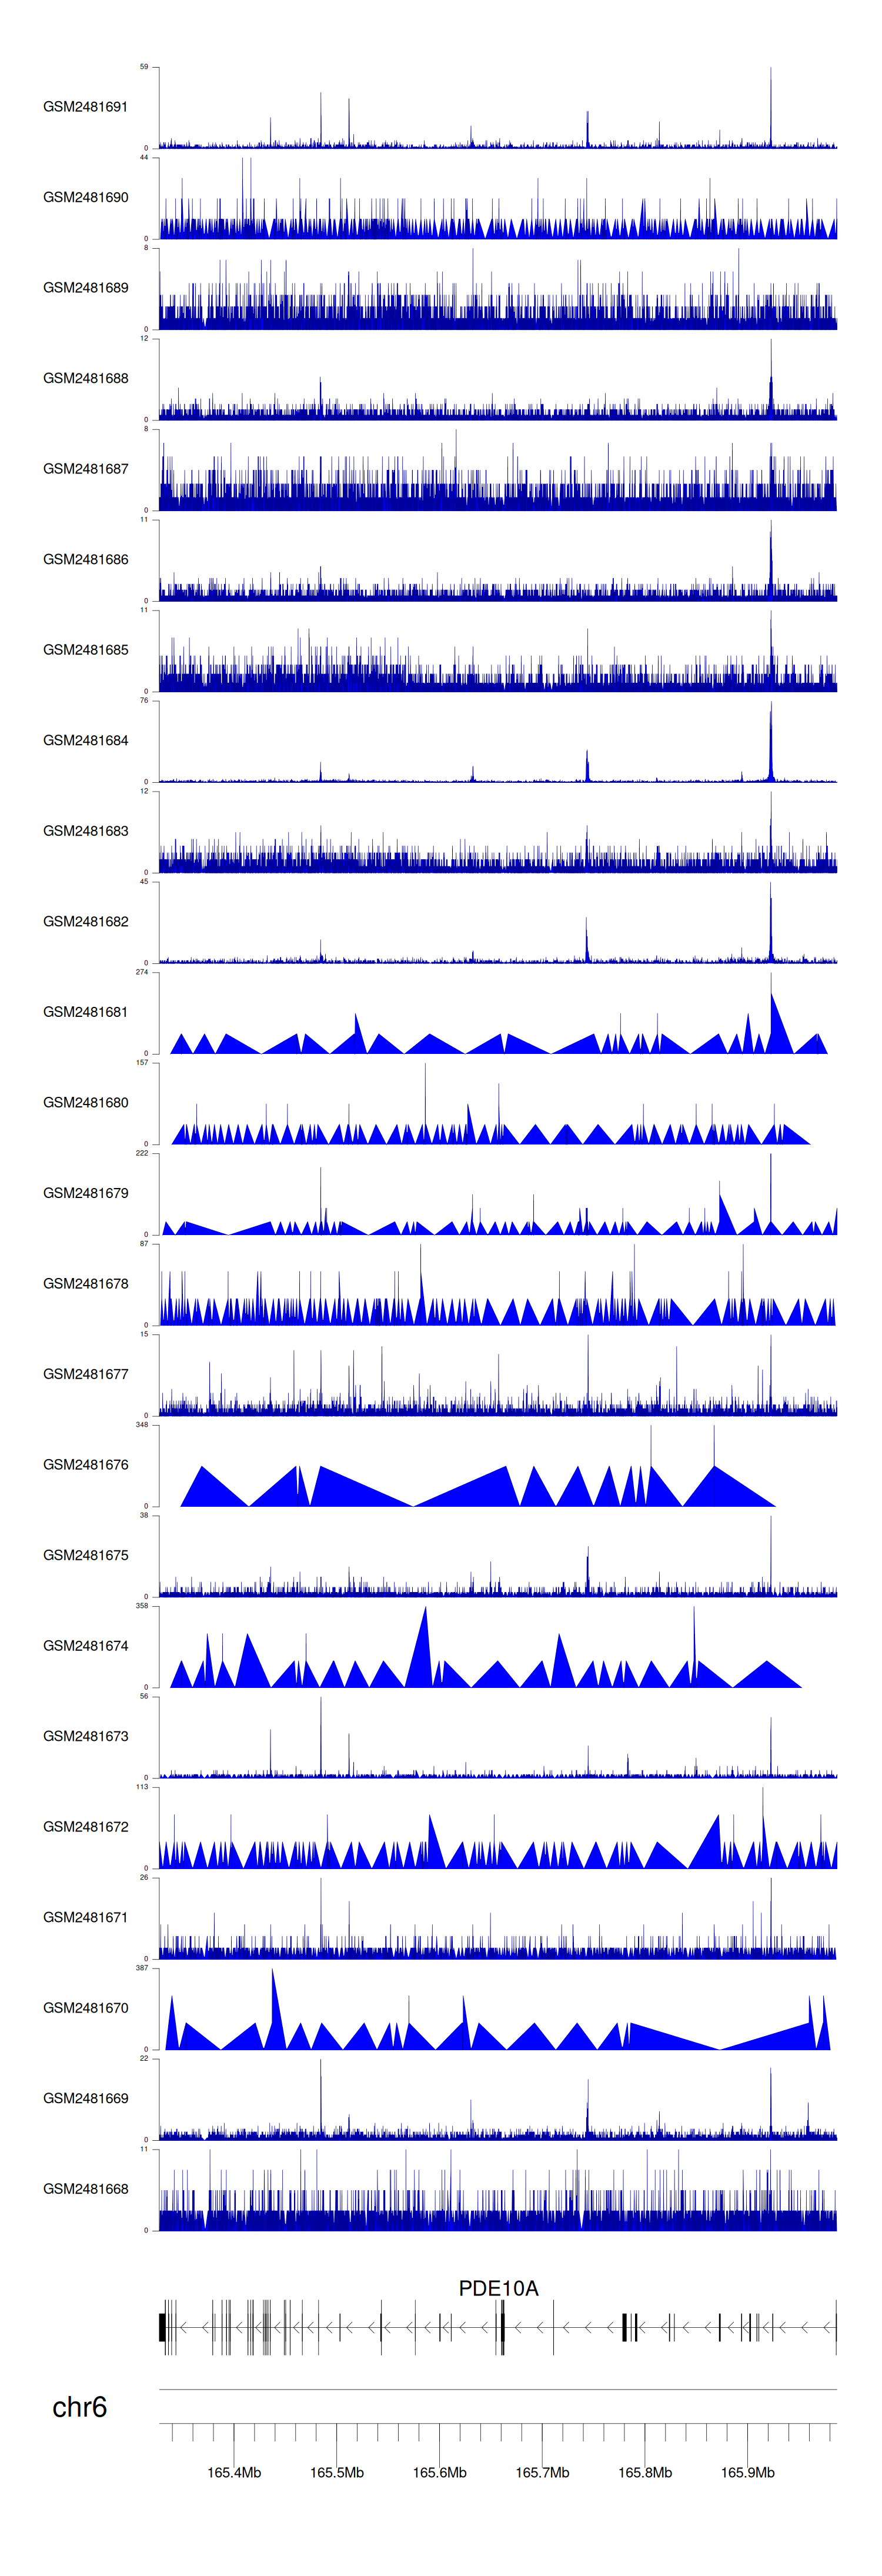
C GSE94732
|
Chip-seq |
24 |
Illumina NextSeq 500 (Homo sapiens);illumina Genome Analyzer IIx (Homo sapiens) |
|
GSE168557
|
Expression array |
6 |
Agilent-039494 SurePrint G3 Human GE v2 8x60K Microarray 039381 (Feature Number version) |
|
GSE52244
|
Expression array |
15 |
[HuEx-1_0-st] Affymetrix Human Exon 1.0 ST Array [probe set (exon) version] |
|
GSE10789
|
Expression array |
6 |
NCI/ATC Hs-OperonV3 |
|
GSE189602
|
Methylation profiling (Array) |
4 |
Infinium MethylationEPIC |
|
GSE136189
|
Methylation profiling (Array) |
40 |
Illumina HumanMethylation450 BeadChip (HumanMethylation450_15017482);Illumina Infinium HumanMethylation850 BeadChip |
When the gene can detect a peak in the dataset, a peak plot will be displayed.
> Dataset: GSE94732 - PDE10A peak across samples
|
Peak Plot
|
|
|
