Gene Information
|
Gene Name
|
PDE8A |
|
Gene ID
|
5151
|
|
Gene Full Name
|
phosphodiesterase 8A |
|
Gene Alias
|
HsT19550 |
|
Transcripts
|
ENSG00000073417
|
|
Virus
|
HTLV1 |
|
Gene Type
|
protein-coding |
|
HPA Location Info
|
Golgi apparatus; 
|
|
Membrane Info
|
Enzymes, Metabolic proteins, Predicted intracellular proteins |
|
Uniport_ID
|
O60658
|
|
HGNC ID
|
HGNC:8793
|
|
OMIM ID
|
602972 |
|
Summary
|
The protein encoded by this gene belongs to the cyclic nucleotide phosphodiesterase (PDE) family, and PDE8 subfamily. This PDE hydrolyzes the second messenger, cAMP, which is a regulator and mediator of a number of cellular responses to extracellular signals. Thus, by regulating the cellular concentration of cAMP, this protein plays a key role in many important physiological processes. Alternatively spliced transcript variants encoding different isoforms have been found for this gene.[provided by RefSeq, Jul 2011] |
Target gene [PDE8A] related to VISs 
Integration Table: if previous studies reported that target gene was altered by virus integration events, the overlap between VISs in this literature and Cistrome factors was listed in this section
| DVID |
Chromosome |
HM |
TFBS |
CA |
Sum of Overlapped Records |
Detail |
| 6007878 |
chr15 |
20 |
28 |
3 |
51 |
View |
| 6018752 |
chr15 |
8 |
1 |
0 |
9 |
View |
Target gene [PDE8A] related to Omics data
| Data ID |
Experiment type |
Sample number |
Platform |
|
GSE189602
|
Methylation profiling (Array) |
4 |
Infinium MethylationEPIC |
|
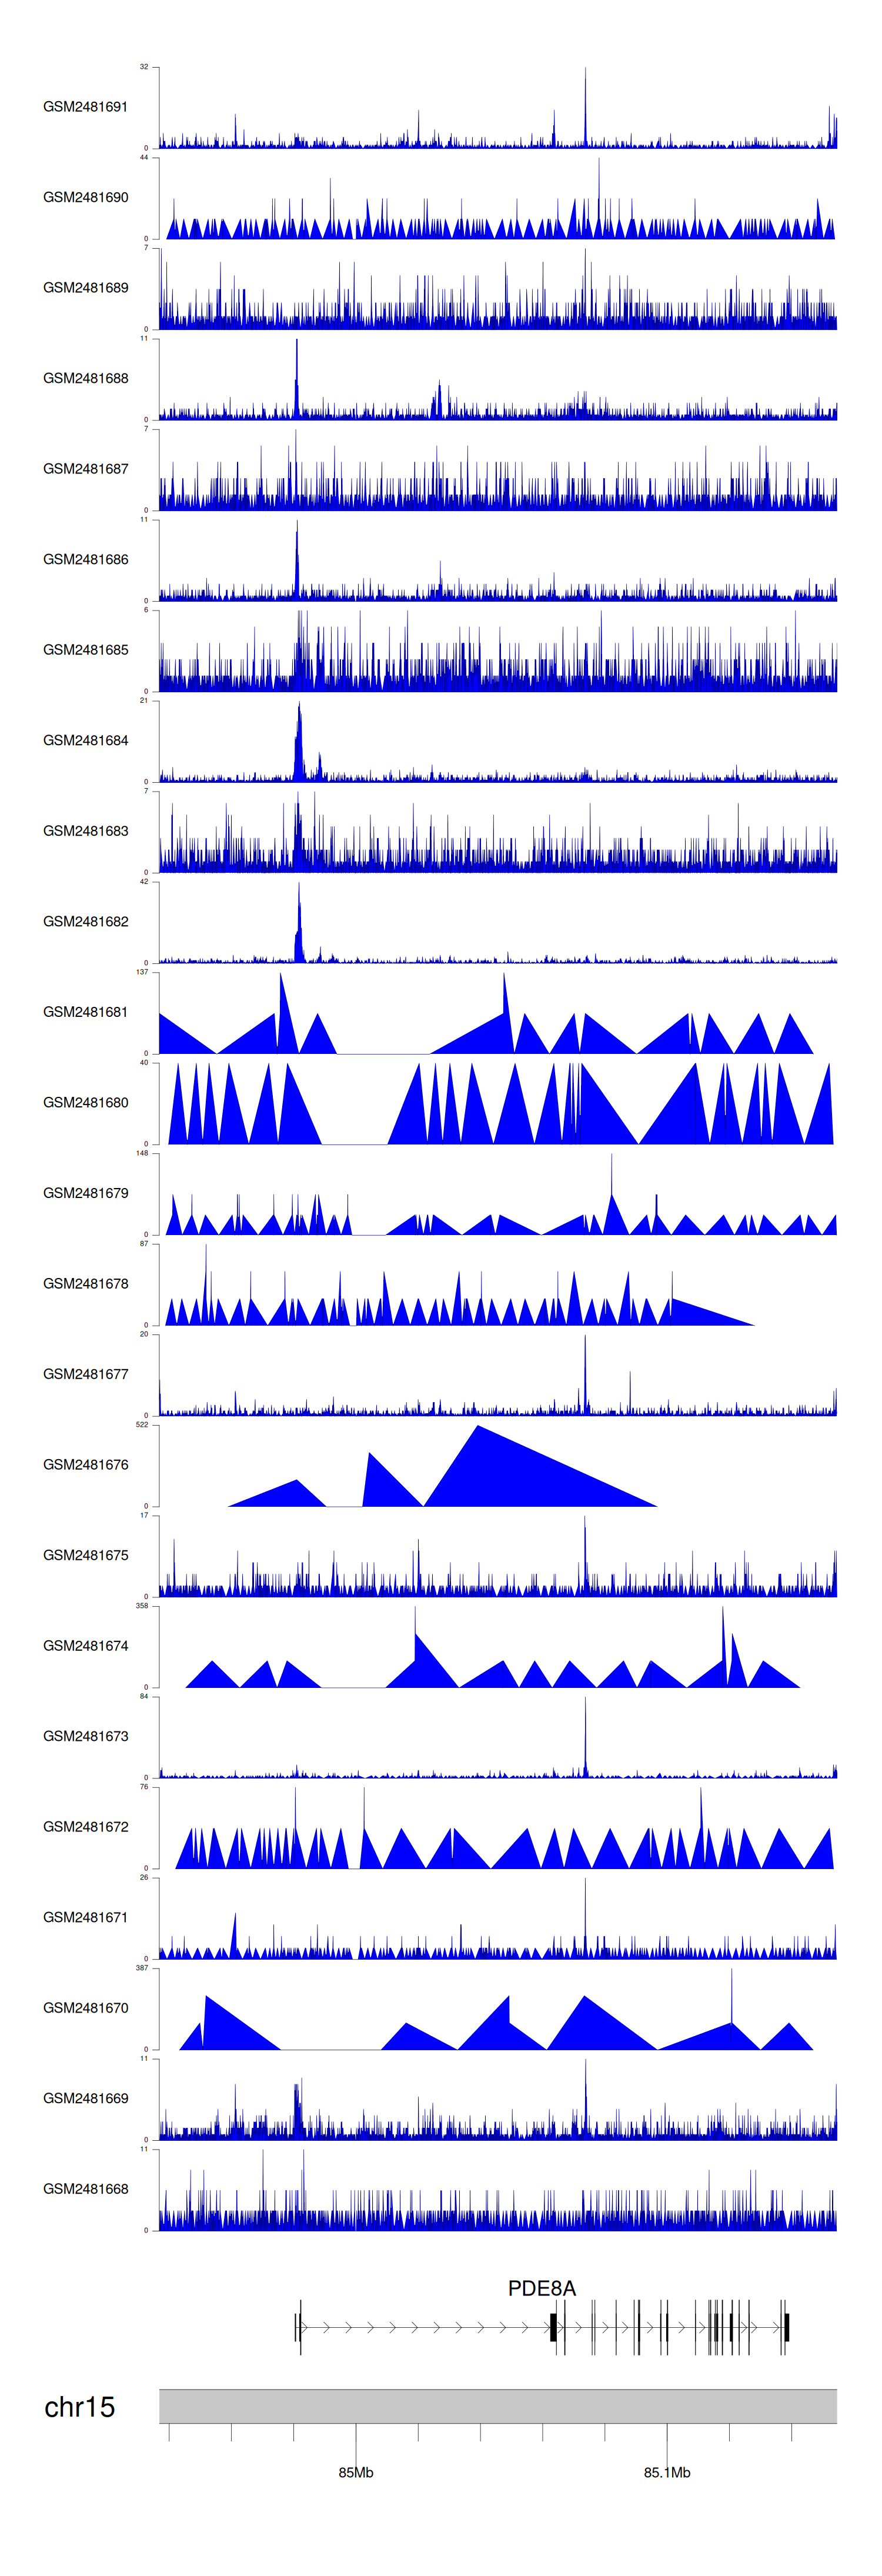
C GSE94732
|
Chip-seq |
24 |
Illumina NextSeq 500 (Homo sapiens);illumina Genome Analyzer IIx (Homo sapiens) |
|
GSE52244
|
Expression array |
15 |
[HuEx-1_0-st] Affymetrix Human Exon 1.0 ST Array [probe set (exon) version] |
|
GSE10789
|
Expression array |
6 |
NCI/ATC Hs-OperonV3 |
|
GSE224047
|
RNA-seq |
10 |
Illumina NextSeq 500 (Homo sapiens) |
|
GSE168557
|
Expression array |
6 |
Agilent-039494 SurePrint G3 Human GE v2 8x60K Microarray 039381 (Feature Number version) |
|
GSE136189
|
Methylation profiling (Array) |
40 |
Illumina HumanMethylation450 BeadChip (HumanMethylation450_15017482);Illumina Infinium HumanMethylation850 BeadChip |
When the gene can detect a peak in the dataset, a peak plot will be displayed.
> Dataset: GSE94732 - PDE8A peak across samples
|
Peak Plot
|
|
|
