Gene Information
|
Gene Name
|
PELI1 |
|
Gene ID
|
57162
|
|
Gene Full Name
|
pellino E3 ubiquitin protein ligase 1 |
|
Gene Alias
|
- |
|
Transcripts
|
ENSG00000197329
|
|
Virus
|
HTLV1 |
|
Gene Type
|
protein-coding |
|
HPA Location Info
|
Nucleoplasm, Nucleoli, Basal body;Intermediate filaments, Centriolar satellite, Centrosome, Cytosol; 
|
|
Membrane Info
|
Enzymes, Predicted intracellular proteins |
|
Uniport_ID
|
Q96FA3
|
|
HGNC ID
|
HGNC:8827
|
|
OMIM ID
|
614797 |
|
Summary
|
Enables ubiquitin-ubiquitin ligase activity. Involved in several processes, including negative regulation of TORC1 signaling; negative regulation of necroptotic process; and protein polyubiquitination. Is active in site of double-strand break. Implicated in colorectal cancer. [provided by Alliance of Genome Resources, Apr 2025] |
Target gene [PELI1] related to VISs 
Integration Table: if previous studies reported that target gene was altered by virus integration events, the overlap between VISs in this literature and Cistrome factors was listed in this section
| DVID |
Chromosome |
HM |
TFBS |
CA |
Sum of Overlapped Records |
Detail |
| 6009405 |
chr2 |
37 |
0 |
0 |
37 |
View |
Target gene [PELI1] related to Omics data
| Data ID |
Experiment type |
Sample number |
Platform |
|
GSE189602
|
Methylation profiling (Array) |
4 |
Infinium MethylationEPIC |
|
C GSE94732
|
Chip-seq |
24 |
Illumina NextSeq 500 (Homo sapiens);illumina Genome Analyzer IIx (Homo sapiens) |
|
GSE52244
|
Expression array |
15 |
[HuEx-1_0-st] Affymetrix Human Exon 1.0 ST Array [probe set (exon) version] |
|
GSE10789
|
Expression array |
6 |
NCI/ATC Hs-OperonV3 |
|
GSE224047
|
RNA-seq |
10 |
Illumina NextSeq 500 (Homo sapiens) |
|
GSE168557
|
Expression array |
6 |
Agilent-039494 SurePrint G3 Human GE v2 8x60K Microarray 039381 (Feature Number version) |
|
GSE136189
|
Methylation profiling (Array) |
40 |
Illumina HumanMethylation450 BeadChip (HumanMethylation450_15017482);Illumina Infinium HumanMethylation850 BeadChip |
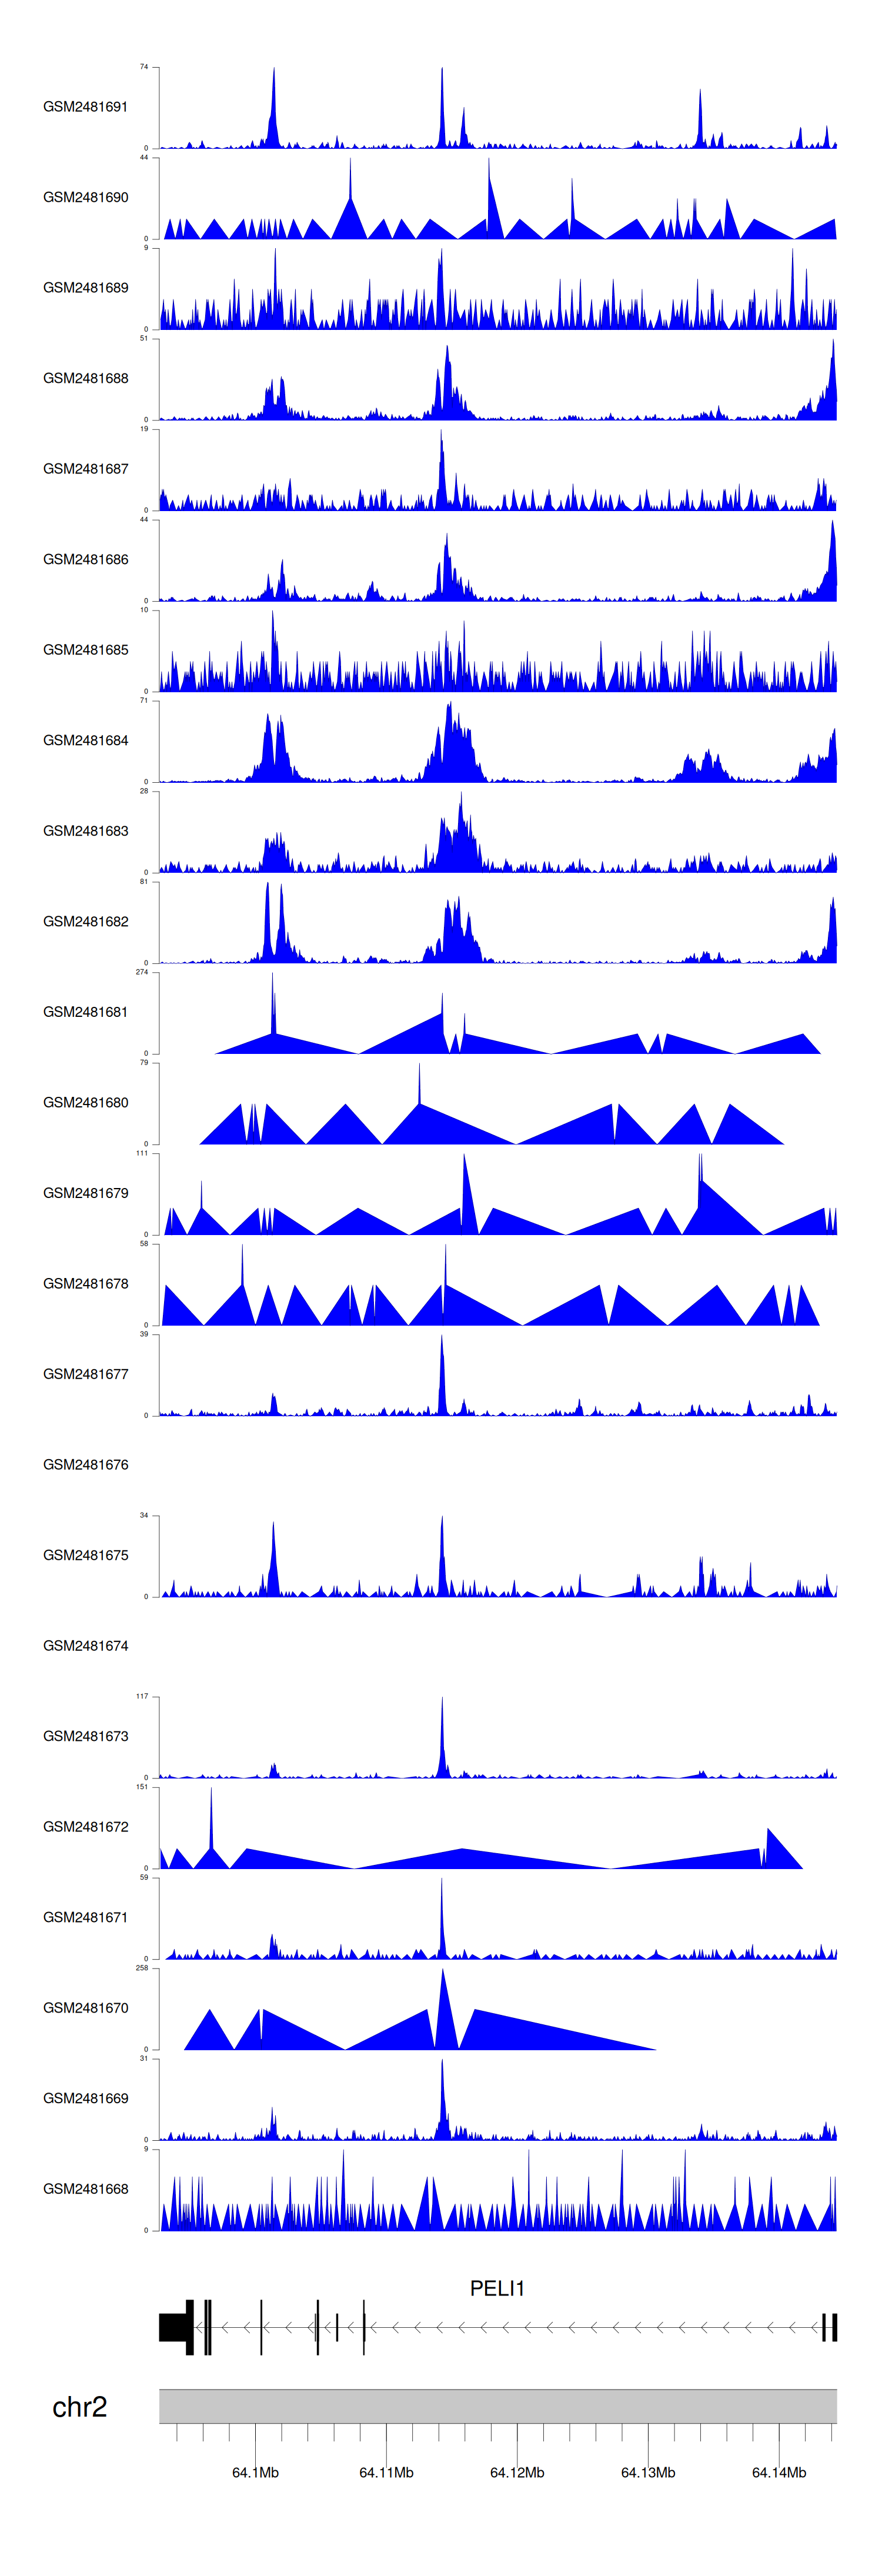
When the gene can detect a peak in the dataset, a peak plot will be displayed.
> Dataset: GSE94732 - PELI1 peak across samples
|
Peak Plot
|
|
|
