Gene Information
|
Gene Name
|
PNLIP |
|
Gene ID
|
5406
|
|
Gene Full Name
|
pancreatic lipase |
|
Gene Alias
|
PL|PNLIPD|PTL |
|
Transcripts
|
ENSG00000175535
|
|
Virus
|
HTLV1 |
|
Gene Type
|
protein-coding |
|
HPA Location Info
|
Secreted to digestive system; 
|
|
Membrane Info
|
Disease related genes, Enzymes, FDA approved drug targets, Human disease related genes, Metabolic proteins, Plasma proteins, Predicted secreted proteins |
|
Uniport_ID
|
P16233
|
|
HGNC ID
|
HGNC:9155
|
|
OMIM ID
|
246600 |
|
Summary
|
This gene encodes a member of the lipase family of proteins. The encoded enzyme is secreted by the pancreas and hydrolyzes triglycerides in the small intestine, and is essential for the efficient digestion of dietary fats. Inhibition of the encoded enzyme may prevent high-fat diet-induced obesity in mice and result in weight loss in human patients with obesity. Mutations in this gene cause congenital pancreatic lipase deficiency, a rare disorder characterized by steatorrhea. [provided by RefSeq, Jul 2016] |
Target gene [PNLIP] related to VISs 
Integration Table: if previous studies reported that target gene was altered by virus integration events, the overlap between VISs in this literature and Cistrome factors was listed in this section
| DVID |
Chromosome |
HM |
TFBS |
CA |
Sum of Overlapped Records |
Detail |
| 6009926 |
chr10 |
14 |
20 |
0 |
34 |
View |
Target gene [PNLIP] related to Omics data
| Data ID |
Experiment type |
Sample number |
Platform |
|
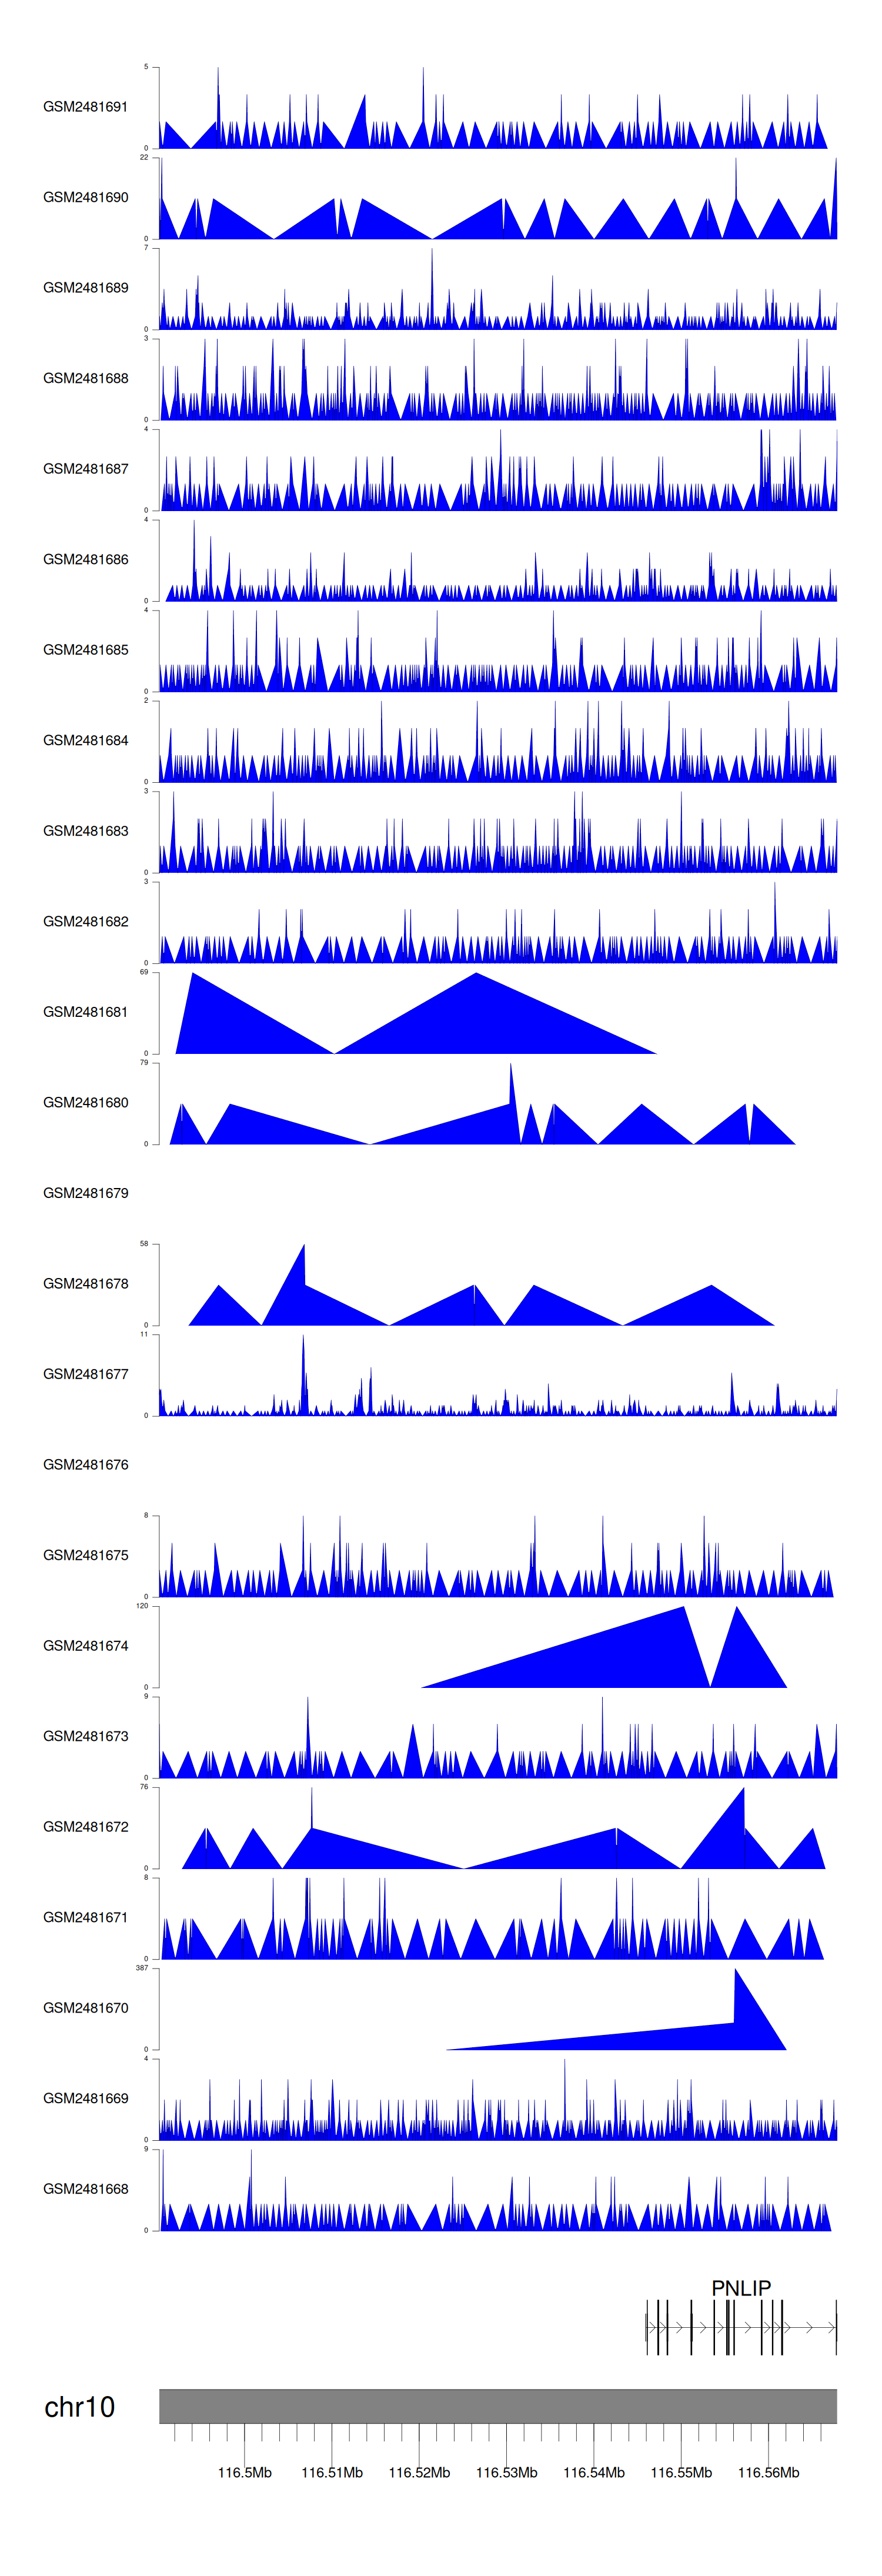
C GSE94732
|
Chip-seq |
24 |
Illumina NextSeq 500 (Homo sapiens);illumina Genome Analyzer IIx (Homo sapiens) |
|
GSE168557
|
Expression array |
6 |
Agilent-039494 SurePrint G3 Human GE v2 8x60K Microarray 039381 (Feature Number version) |
|
GSE52244
|
Expression array |
15 |
[HuEx-1_0-st] Affymetrix Human Exon 1.0 ST Array [probe set (exon) version] |
|
GSE10789
|
Expression array |
6 |
NCI/ATC Hs-OperonV3 |
|
GSE189602
|
Methylation profiling (Array) |
4 |
Infinium MethylationEPIC |
|
M GSE136189
|
Methylation profiling (Array) |
40 |
Illumina HumanMethylation450 BeadChip (HumanMethylation450_15017482);Illumina Infinium HumanMethylation850 BeadChip |
When the query gene is differentially changed in the dataset, a volcano/bar plot will be displayed.
> Dataset: GSE94732 - PNLIP peak across samples
|
Peak Plot
|
|
|
