Gene Information
|
Gene Name
|
PNPLA3 |
|
Gene ID
|
80339
|
|
Gene Full Name
|
patatin like domain 3, 1-acylglycerol-3-phosphate O-acyltransferase |
|
Gene Alias
|
ADPN|C22orf20|iPLA(2)epsilon |
|
Transcripts
|
ENSG00000100344
|
|
Virus
|
HTLV1 |
|
Gene Type
|
protein-coding |
|
HPA Location Info
|
Nucleoli;Mitochondria, Cytosol; 
|
|
Membrane Info
|
Disease related genes, Enzymes, Human disease related genes, Metabolic proteins, Plasma proteins, Potential drug targets, Predicted intracellular proteins |
|
Uniport_ID
|
Q9NST1
|
|
HGNC ID
|
HGNC:18590
|
|
OMIM ID
|
609567 |
|
Summary
|
The protein encoded by this gene is a triacylglycerol lipase that mediates triacylglycerol hydrolysis in adipocytes. The encoded protein, which appears to be membrane bound, may be involved in the balance of energy usage/storage in adipocytes. [provided by RefSeq, Jul 2008] |
Target gene [PNPLA3] related to VISs 
Integration Table: if previous studies reported that target gene was altered by virus integration events, the overlap between VISs in this literature and Cistrome factors was listed in this section
| DVID |
Chromosome |
HM |
TFBS |
CA |
Sum of Overlapped Records |
Detail |
| 6000806 |
chr22 |
197 |
457 |
178 |
832 |
View |
Target gene [PNPLA3] related to Omics data
| Data ID |
Experiment type |
Sample number |
Platform |
|
C GSE94732
|
Chip-seq |
24 |
Illumina NextSeq 500 (Homo sapiens);illumina Genome Analyzer IIx (Homo sapiens) |
|
GSE168557
|
Expression array |
6 |
Agilent-039494 SurePrint G3 Human GE v2 8x60K Microarray 039381 (Feature Number version) |
|
GSE52244
|
Expression array |
15 |
[HuEx-1_0-st] Affymetrix Human Exon 1.0 ST Array [probe set (exon) version] |
|
GSE10789
|
Expression array |
6 |
NCI/ATC Hs-OperonV3 |
|
GSE189602
|
Methylation profiling (Array) |
4 |
Infinium MethylationEPIC |
|
GSE136189
|
Methylation profiling (Array) |
40 |
Illumina HumanMethylation450 BeadChip (HumanMethylation450_15017482);Illumina Infinium HumanMethylation850 BeadChip |
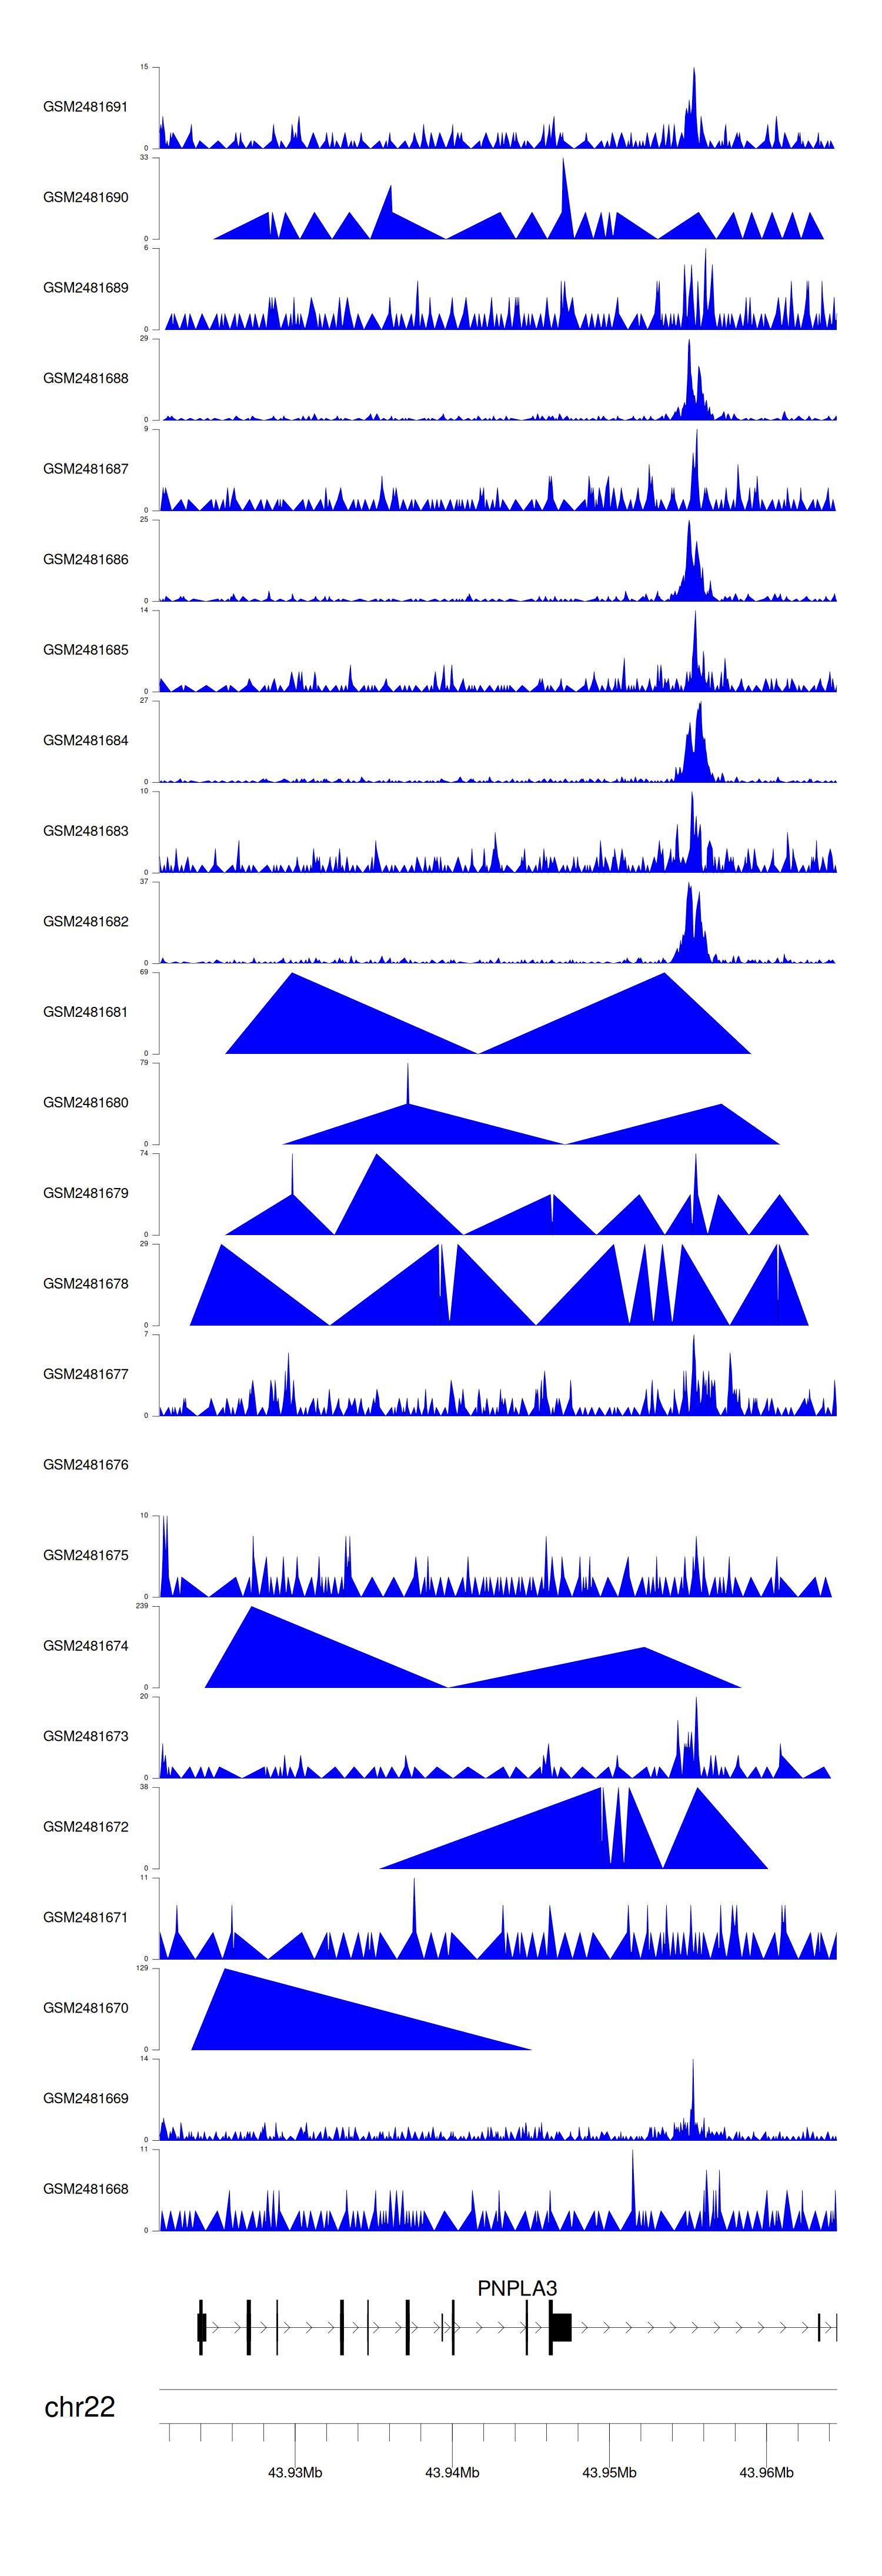
When the gene can detect a peak in the dataset, a peak plot will be displayed.
> Dataset: GSE94732 - PNPLA3 peak across samples
|
Peak Plot
|
|
|
