Gene Information
|
Gene Name
|
PPCS |
|
Gene ID
|
79717
|
|
Gene Full Name
|
phosphopantothenoylcysteine synthetase |
|
Gene Alias
|
CMD2C |
|
Transcripts
|
ENSG00000127125
|
|
Virus
|
HTLV1 |
|
Gene Type
|
protein-coding |
|
HPA Location Info
|
Mitochondria; 
|
|
Membrane Info
|
Disease related genes, Enzymes, Human disease related genes, Metabolic proteins, Potential drug targets, Predicted intracellular proteins |
|
Uniport_ID
|
Q9HAB8
|
|
HGNC ID
|
HGNC:25686
|
|
OMIM ID
|
609853 |
|
Summary
|
Biosynthesis of coenzyme A (CoA) from pantothenic acid (vitamin B5) is an essential universal pathway in prokaryotes and eukaryotes. PPCS (EC 6.3.2.5), one of the last enzymes in this pathway, converts phosphopantothenate to phosphopantothenoylcysteine (Daugherty et al., 2002 [PubMed 11923312]).[supplied by OMIM, Mar 2008] |
Target gene [PPCS] related to VISs 
Integration Table: if previous studies reported that target gene was altered by virus integration events, the overlap between VISs in this literature and Cistrome factors was listed in this section
| DVID |
Chromosome |
HM |
TFBS |
CA |
Sum of Overlapped Records |
Detail |
| 6000944 |
chr1 |
659 |
32 |
4 |
695 |
View |
Target gene [PPCS] related to Omics data
| Data ID |
Experiment type |
Sample number |
Platform |
|
C GSE94732
|
Chip-seq |
24 |
Illumina NextSeq 500 (Homo sapiens);illumina Genome Analyzer IIx (Homo sapiens) |
|
GSE168557
|
Expression array |
6 |
Agilent-039494 SurePrint G3 Human GE v2 8x60K Microarray 039381 (Feature Number version) |
|
GSE52244
|
Expression array |
15 |
[HuEx-1_0-st] Affymetrix Human Exon 1.0 ST Array [probe set (exon) version] |
|
GSE10789
|
Expression array |
6 |
NCI/ATC Hs-OperonV3 |
|
GSE189602
|
Methylation profiling (Array) |
4 |
Infinium MethylationEPIC |
|
GSE136189
|
Methylation profiling (Array) |
40 |
Illumina HumanMethylation450 BeadChip (HumanMethylation450_15017482);Illumina Infinium HumanMethylation850 BeadChip |
When the gene can detect a peak in the dataset, a peak plot will be displayed.
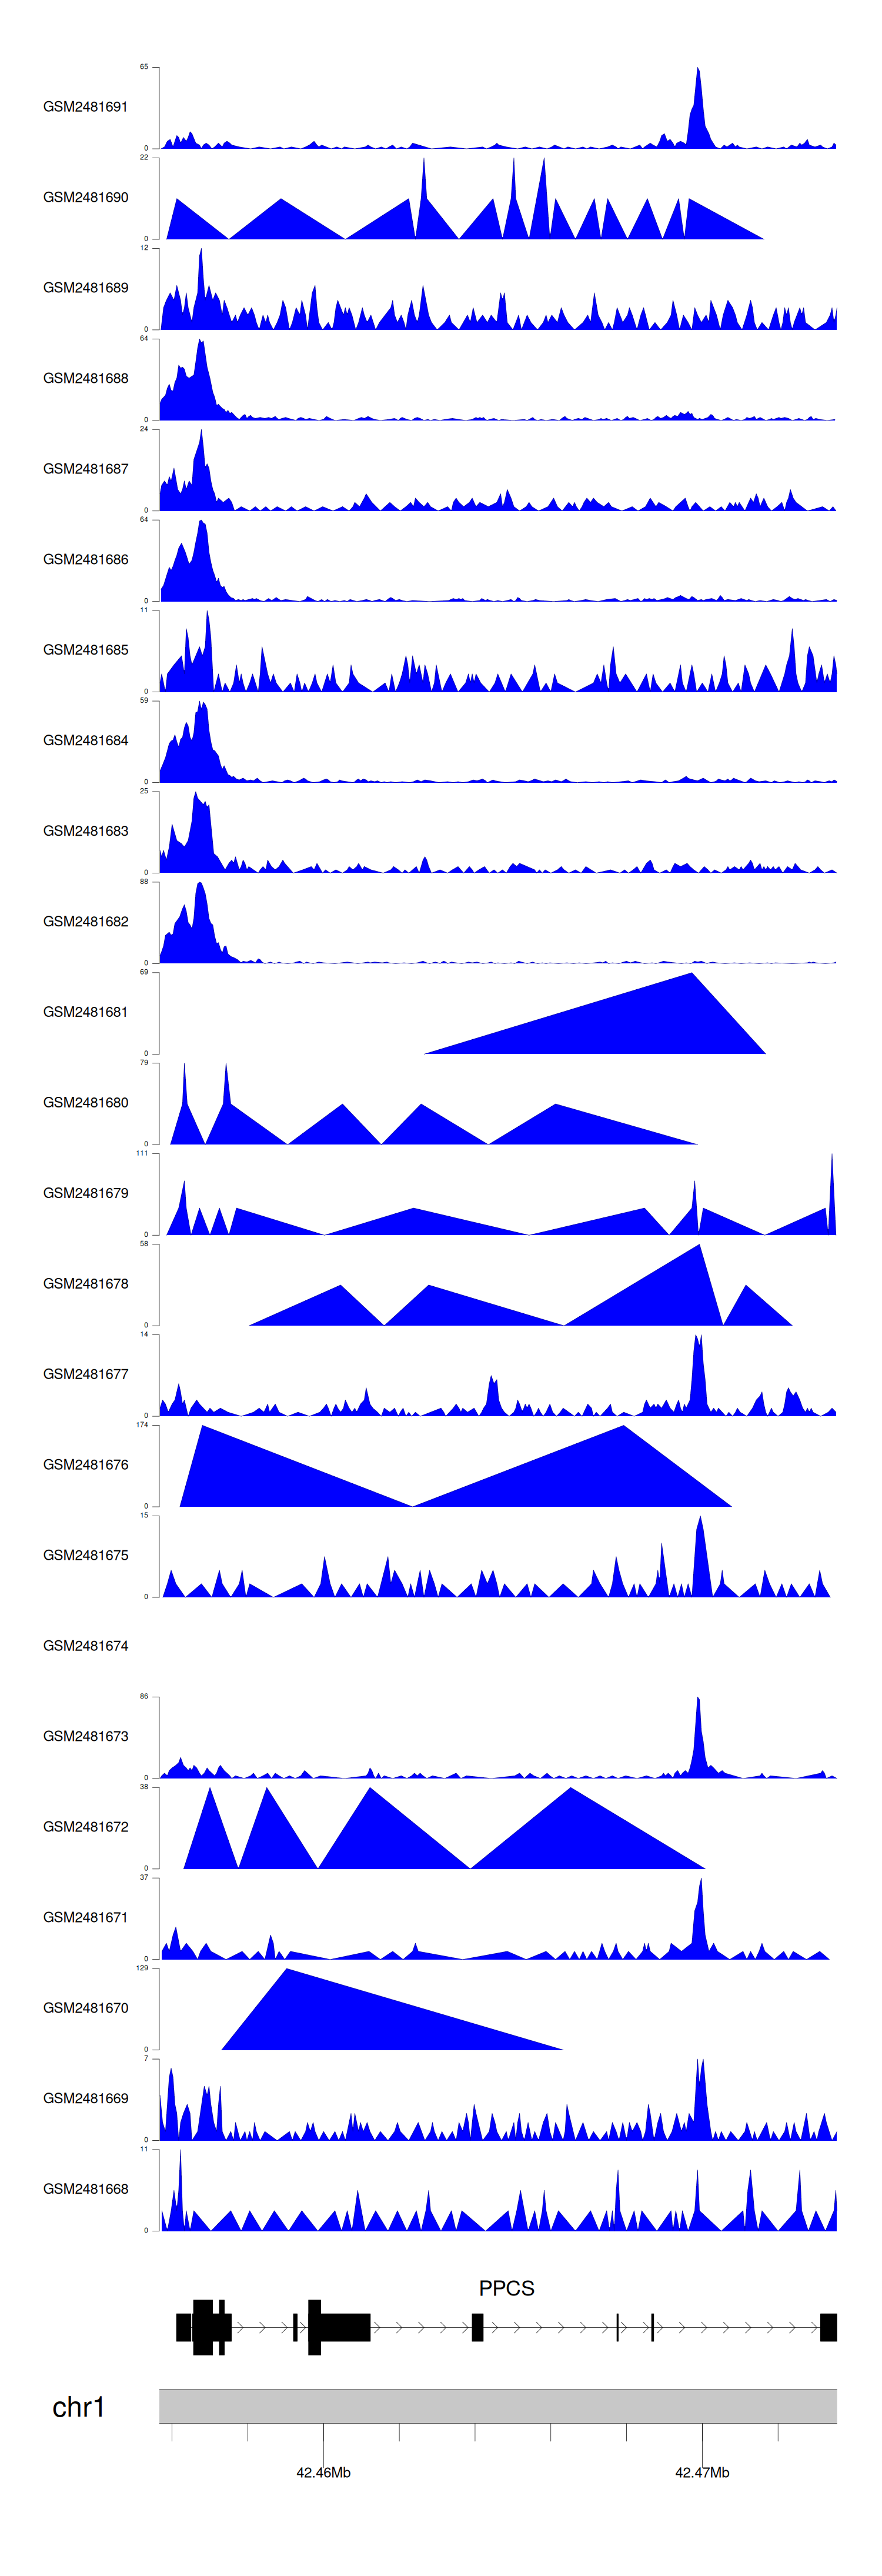
> Dataset: GSE94732 - PPCS peak across samples
|
Peak Plot
|
|
|
