Gene Information
|
Gene Name
|
PRMT8 |
|
Gene ID
|
56341
|
|
Gene Full Name
|
protein arginine methyltransferase 8 |
|
Gene Alias
|
HRMT1L3|HRMT1L4 |
|
Transcripts
|
ENSG00000111218
|
|
Virus
|
HTLV1 |
|
Gene Type
|
protein-coding |
|
HPA Location Info
|

|
|
Membrane Info
|
Enzymes, Predicted intracellular proteins |
|
Uniport_ID
|
Q9NR22
|
|
HGNC ID
|
HGNC:5188
|
|
OMIM ID
|
610086 |
|
Summary
|
Arginine methylation is a widespread posttranslational modification mediated by arginine methyltransferases, such as PRMT8. Arginine methylation is involved in a number of cellular processes, including DNA repair, RNA transcription, signal transduction, protein compartmentalization, and possibly protein translation (Lee et al., 2005 [PubMed 16051612]).[supplied by OMIM, Mar 2008] |
Target gene [PRMT8] related to VISs 
Integration Table: if previous studies reported that target gene was altered by virus integration events, the overlap between VISs in this literature and Cistrome factors was listed in this section
| DVID |
Chromosome |
HM |
TFBS |
CA |
Sum of Overlapped Records |
Detail |
| 6012601 |
chr12 |
21 |
0 |
1 |
22 |
View |
| 6015264 |
chr12 |
11 |
3 |
0 |
14 |
View |
Target gene [PRMT8] related to Omics data
| Data ID |
Experiment type |
Sample number |
Platform |
|
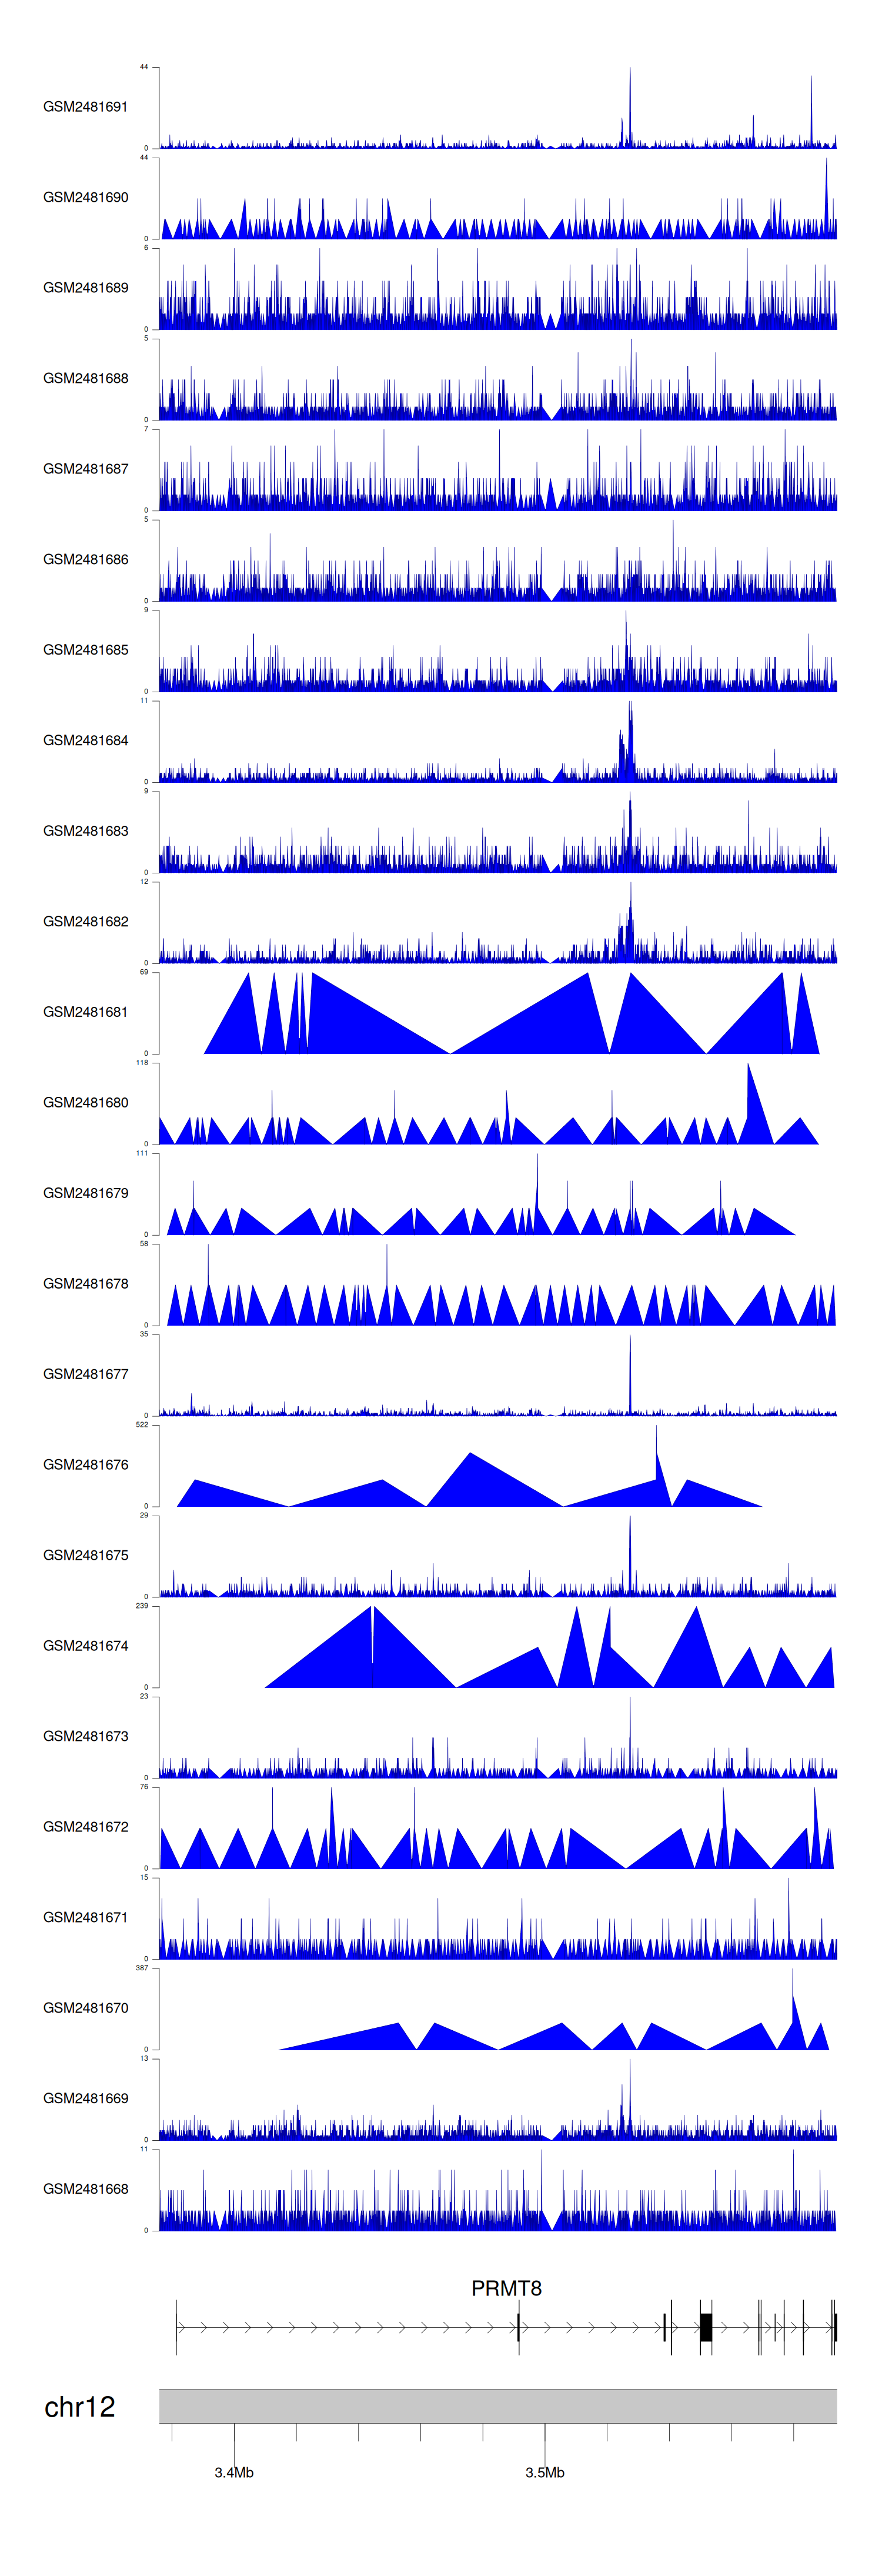
C GSE94732
|
Chip-seq |
24 |
Illumina NextSeq 500 (Homo sapiens);illumina Genome Analyzer IIx (Homo sapiens) |
|
GSE168557
|
Expression array |
6 |
Agilent-039494 SurePrint G3 Human GE v2 8x60K Microarray 039381 (Feature Number version) |
|
GSE52244
|
Expression array |
15 |
[HuEx-1_0-st] Affymetrix Human Exon 1.0 ST Array [probe set (exon) version] |
|
GSE10789
|
Expression array |
6 |
NCI/ATC Hs-OperonV3 |
|
GSE189602
|
Methylation profiling (Array) |
4 |
Infinium MethylationEPIC |
|
GSE136189
|
Methylation profiling (Array) |
40 |
Illumina HumanMethylation450 BeadChip (HumanMethylation450_15017482);Illumina Infinium HumanMethylation850 BeadChip |
When the gene can detect a peak in the dataset, a peak plot will be displayed.
> Dataset: GSE94732 - PRMT8 peak across samples
|
Peak Plot
|
|
|
