Gene Information
|
Gene Name
|
PTCH1 |
|
Gene ID
|
5727
|
|
Gene Full Name
|
patched 1 |
|
Gene Alias
|
BCNS|BCNS1|NBCCS|PTC|PTC1|PTCH|SLC65B1 |
|
Transcripts
|
ENSG00000185920
|
|
Virus
|
HBV |
|
Gene Type
|
protein-coding |
|
HPA Location Info
|
Golgi apparatus;Primary cilium; 
|
|
Membrane Info
|
Cancer-related genes, Disease related genes, Human disease related genes, Potential drug targets, Predicted intracellular proteins, Predicted membrane proteins, Transporters |
|
Uniport_ID
|
Q13635
|
|
HGNC ID
|
HGNC:9585
|
|
OMIM ID
|
601309 |
|
Summary
|
This gene encodes a member of the patched family of proteins and a component of the hedgehog signaling pathway. Hedgehog signaling is important in embryonic development and tumorigenesis. The encoded protein is the receptor for the secreted hedgehog ligands, which include sonic hedgehog, indian hedgehog and desert hedgehog. Following binding by one of the hedgehog ligands, the encoded protein is trafficked away from the primary cilium, relieving inhibition of the G-protein-coupled receptor smoothened, which results in activation of downstream signaling. Mutations of this gene have been associated with basal cell nevus syndrome and holoprosencephaly. [provided by RefSeq, Aug 2017] |
Target gene [PTCH1] related to VISs 
Integration Table: if previous studies reported that target gene was altered by virus integration events, the overlap between VISs in this literature and Cistrome factors was listed in this section
| DVID |
Chromosome |
HM |
TFBS |
CA |
Sum of Overlapped Records |
Detail |
| 1043469 |
chr9 |
44 |
4 |
11 |
59 |
View |
Target gene [PTCH1] related to Omics data
| Data ID |
Experiment type |
Sample number |
Platform |
|
GSE236281
|
RNA-seq |
12 |
Illumina MiSeq (Homo sapiens) |
|
C GSE35465
|
Chip-seq;RNA-seq |
6 |
Illumina HiSeq 2000 (Homo sapiens) |
|
C GSE68402
|
Chip-seq |
26 |
Illumina MiSeq (Homo sapiens);Illumina HiSeq 2500 (Homo sapiens) |
|
GSE247322
|
scRNA-seq |
27 |
Illumina NovaSeq 6000 (Homo sapiens) |
|
TCGA_LIHC_HBV
|
DNA methylation sequencing;RNA-seq |
97 |
TCGA |
|
C GSE270130
|
Chip-seq |
27 |
Illumina NovaSeq 6000 (Homo sapiens) |
|
GSE224901
|
RNA-seq |
21 |
Illumina NovaSeq 6000 (Homo sapiens) |
|
GSE100400
|
Chip-seq;RNA-seq;4C_cccDNA |
31 |
Illumina NextSeq 500 (Homo sapiens);Illumina NextSeq 500 (Mus musculus) |
|
GSE173897
|
RNA-seq |
95 |
Illumina HiSeq 4000 (Homo sapiens) |
|
GSE262515
|
RNA-seq |
21 |
Illumina HiSeq 2500 (Homo sapiens);Illumina HiSeq 2500 (Mus musculus) |
|
GSE110345
|
RNA-seq |
4 |
Illumina HiSeq 2500 (Homo sapiens) |
|
C GSE131257
|
ATAC-seq;RNA-seq |
19 |
Illumina HiSeq 2500 (Homo sapiens) |
|
GSE94660
|
RNA-seq |
42 |
Illumina HiSeq 2500 (Homo sapiens) |
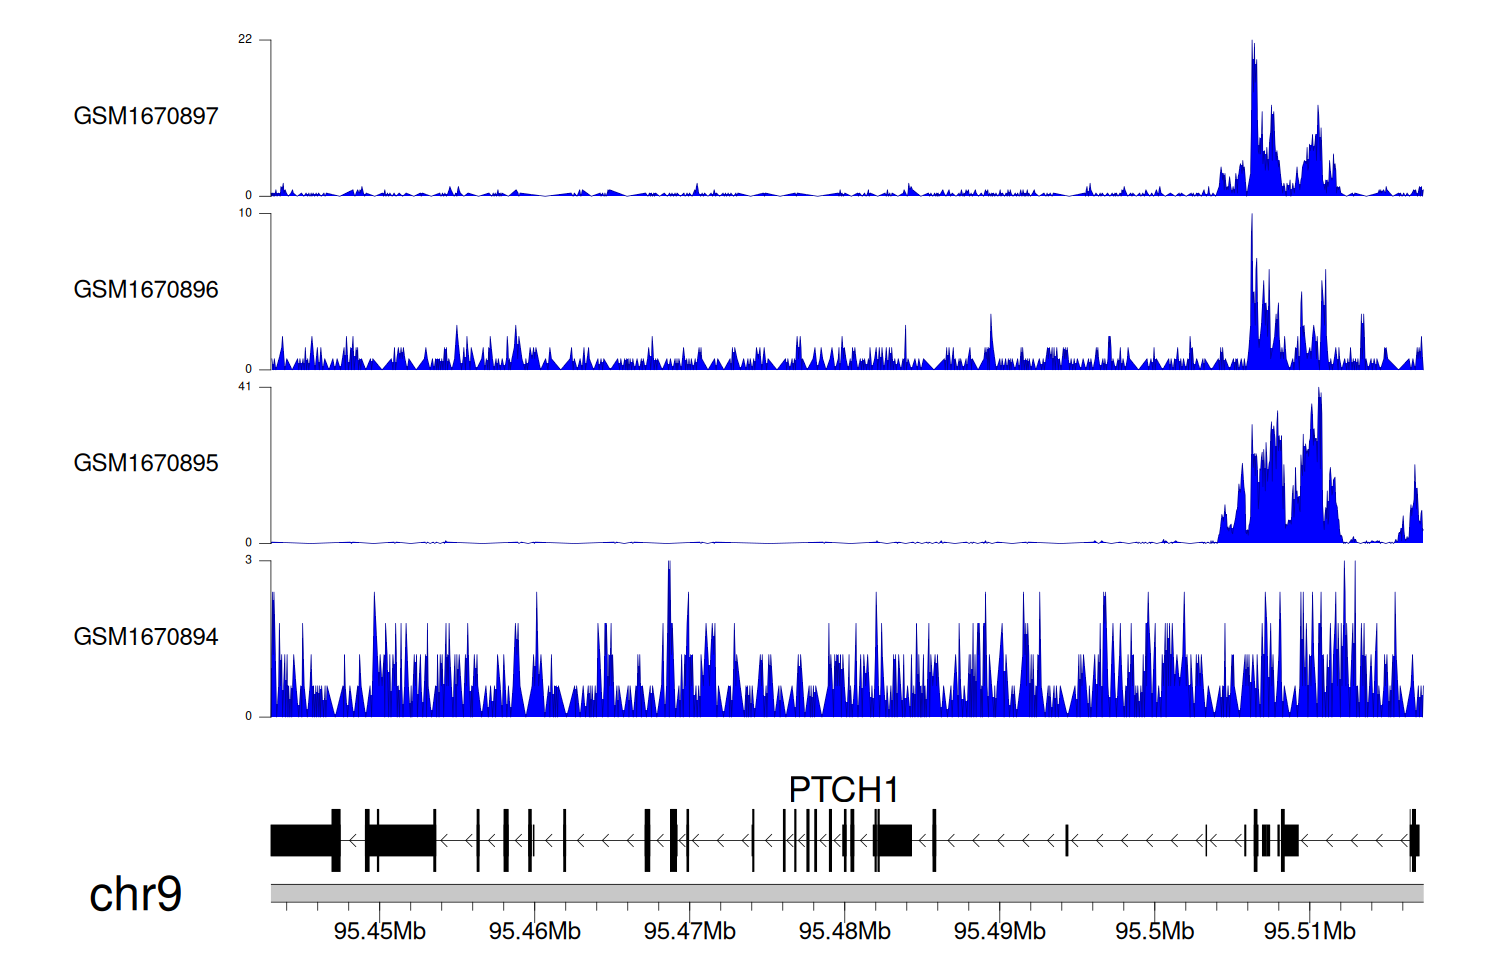
When the gene can detect a peak in the dataset, a peak plot will be displayed.
> Dataset: GSE35465 - PTCH1 peak across samples
|
Peak Plot

|
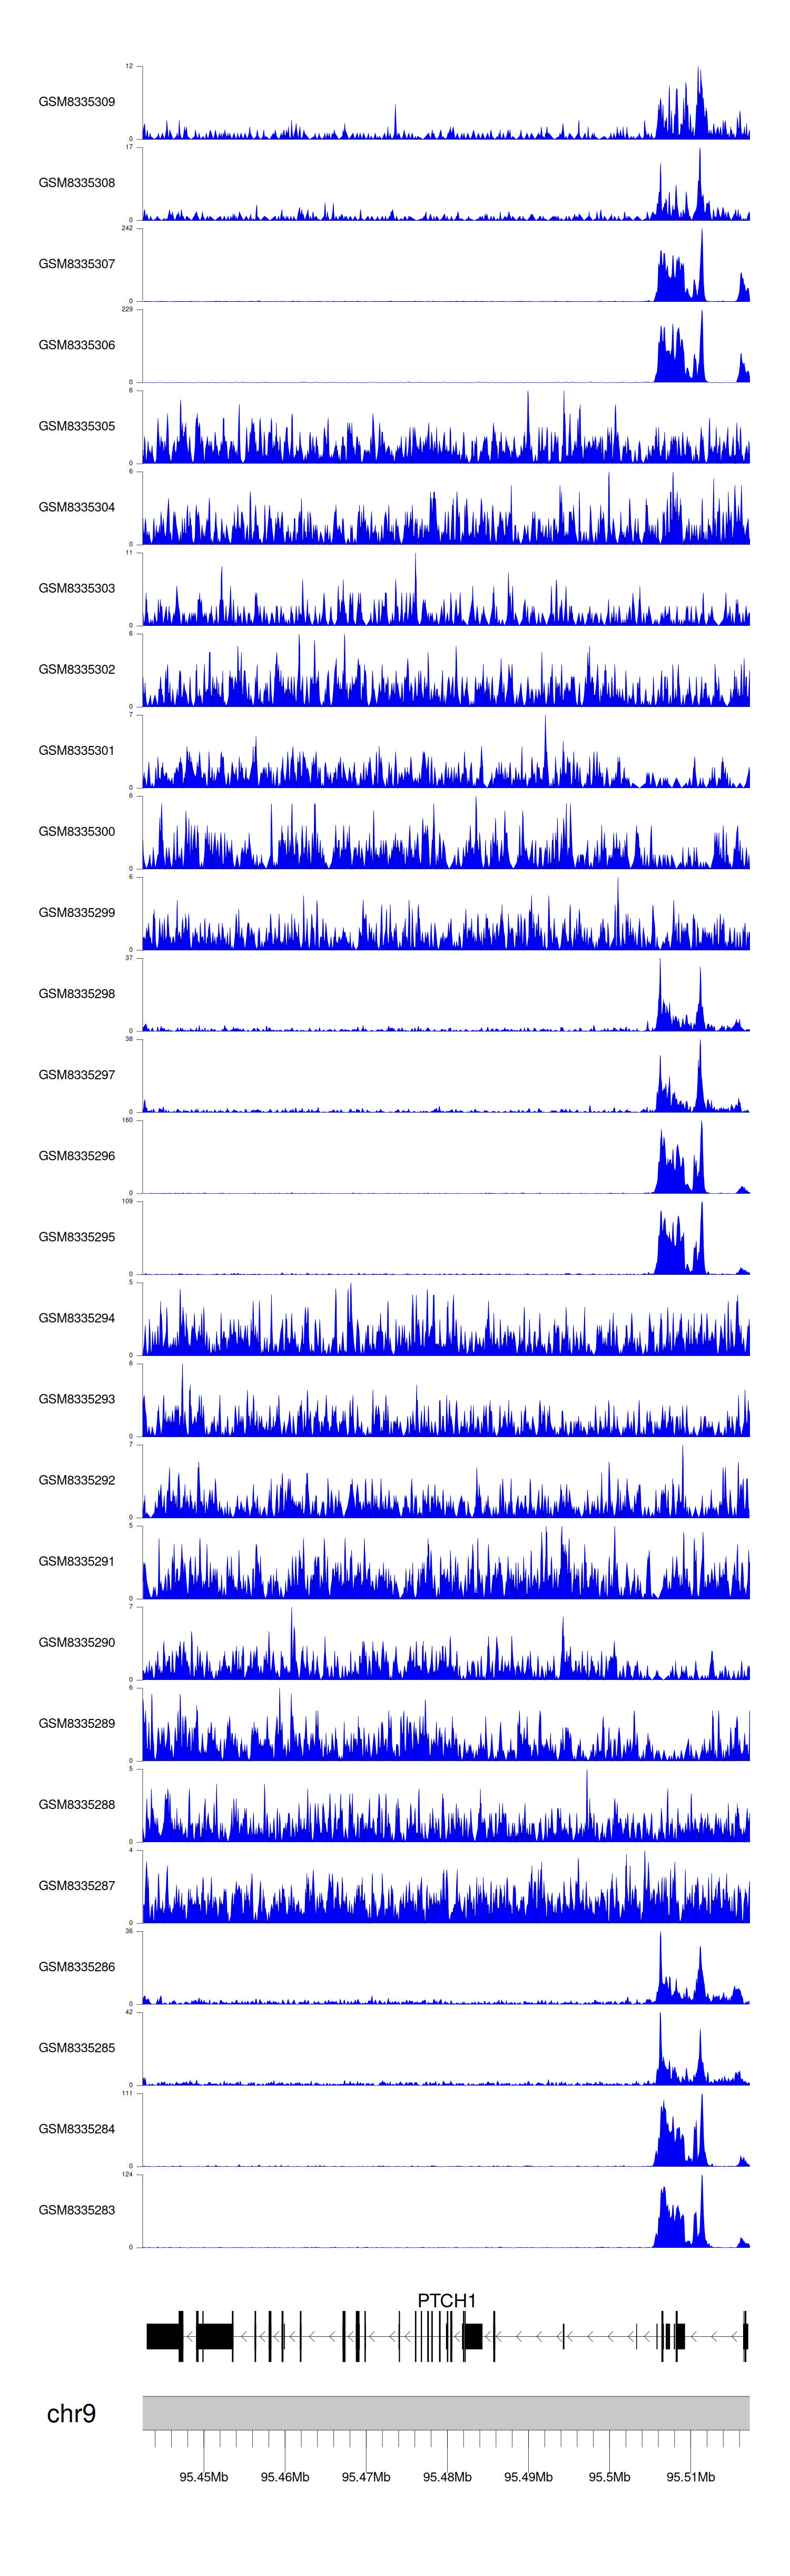
> Dataset: GSE68402 - PTCH1 peak across samples
|
Peak Plot
|
> Dataset: GSE270130 - PTCH1 peak across samples
|
Peak Plot
|
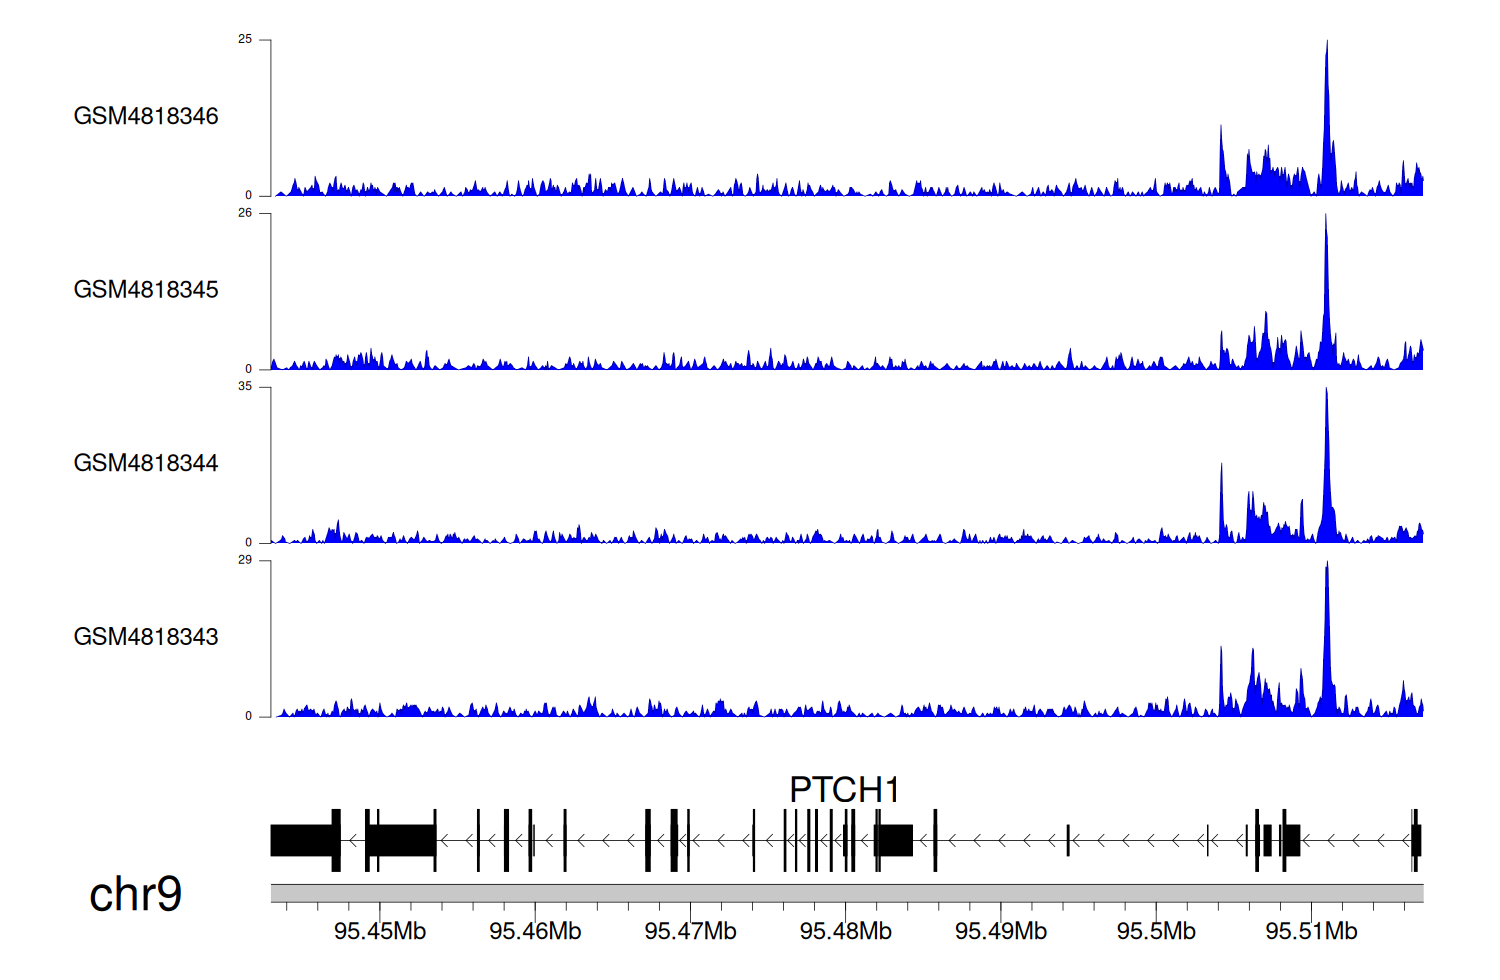
> Dataset: GSE131257 - PTCH1 peak across samples
|
Peak Plot
|
|
|
