Gene Information
|
Gene Name
|
PTGIS |
|
Gene ID
|
5740
|
|
Gene Full Name
|
prostaglandin I2 synthase |
|
Gene Alias
|
CYP8|CYP8A1|PGIS|PTGI |
|
Transcripts
|
ENSG00000124212
|
|
Virus
|
HTLV1 |
|
Gene Type
|
protein-coding |
|
HPA Location Info
|
Endoplasmic reticulum;Golgi apparatus, Cytosol; 
|
|
Membrane Info
|
Disease related genes, Enzymes, FDA approved drug targets, Metabolic proteins, Plasma proteins, Predicted membrane proteins |
|
Uniport_ID
|
Q16647
|
|
HGNC ID
|
HGNC:9603
|
|
OMIM ID
|
601699 |
|
Summary
|
This gene encodes a member of the cytochrome P450 superfamily of enzymes. The cytochrome P450 proteins are monooxygenases which catalyze many reactions involved in drug metabolism and synthesis of cholesterol, steroids and other lipids. However, this protein is considered a member of the cytochrome P450 superfamily on the basis of sequence similarity rather than functional similarity. This endoplasmic reticulum membrane protein catalyzes the conversion of prostglandin H2 to prostacyclin (prostaglandin I2), a potent vasodilator and inhibitor of platelet aggregation. An imbalance of prostacyclin and its physiological antagonist thromboxane A2 contribute to the development of myocardial infarction, stroke, and atherosclerosis. [provided by RefSeq, Jul 2008] |
Target gene [PTGIS] related to VISs 
Integration Table: if previous studies reported that target gene was altered by virus integration events, the overlap between VISs in this literature and Cistrome factors was listed in this section
| DVID |
Chromosome |
HM |
TFBS |
CA |
Sum of Overlapped Records |
Detail |
| 6008156 |
chr20 |
21 |
11 |
16 |
48 |
View |
Target gene [PTGIS] related to Omics data
| Data ID |
Experiment type |
Sample number |
Platform |
|
C GSE94732
|
Chip-seq |
24 |
Illumina NextSeq 500 (Homo sapiens);illumina Genome Analyzer IIx (Homo sapiens) |
|
GSE168557
|
Expression array |
6 |
Agilent-039494 SurePrint G3 Human GE v2 8x60K Microarray 039381 (Feature Number version) |
|
GSE52244
|
Expression array |
15 |
[HuEx-1_0-st] Affymetrix Human Exon 1.0 ST Array [probe set (exon) version] |
|
GSE10789
|
Expression array |
6 |
NCI/ATC Hs-OperonV3 |
|
GSE189602
|
Methylation profiling (Array) |
4 |
Infinium MethylationEPIC |
|
GSE136189
|
Methylation profiling (Array) |
40 |
Illumina HumanMethylation450 BeadChip (HumanMethylation450_15017482);Illumina Infinium HumanMethylation850 BeadChip |
When the gene can detect a peak in the dataset, a peak plot will be displayed.
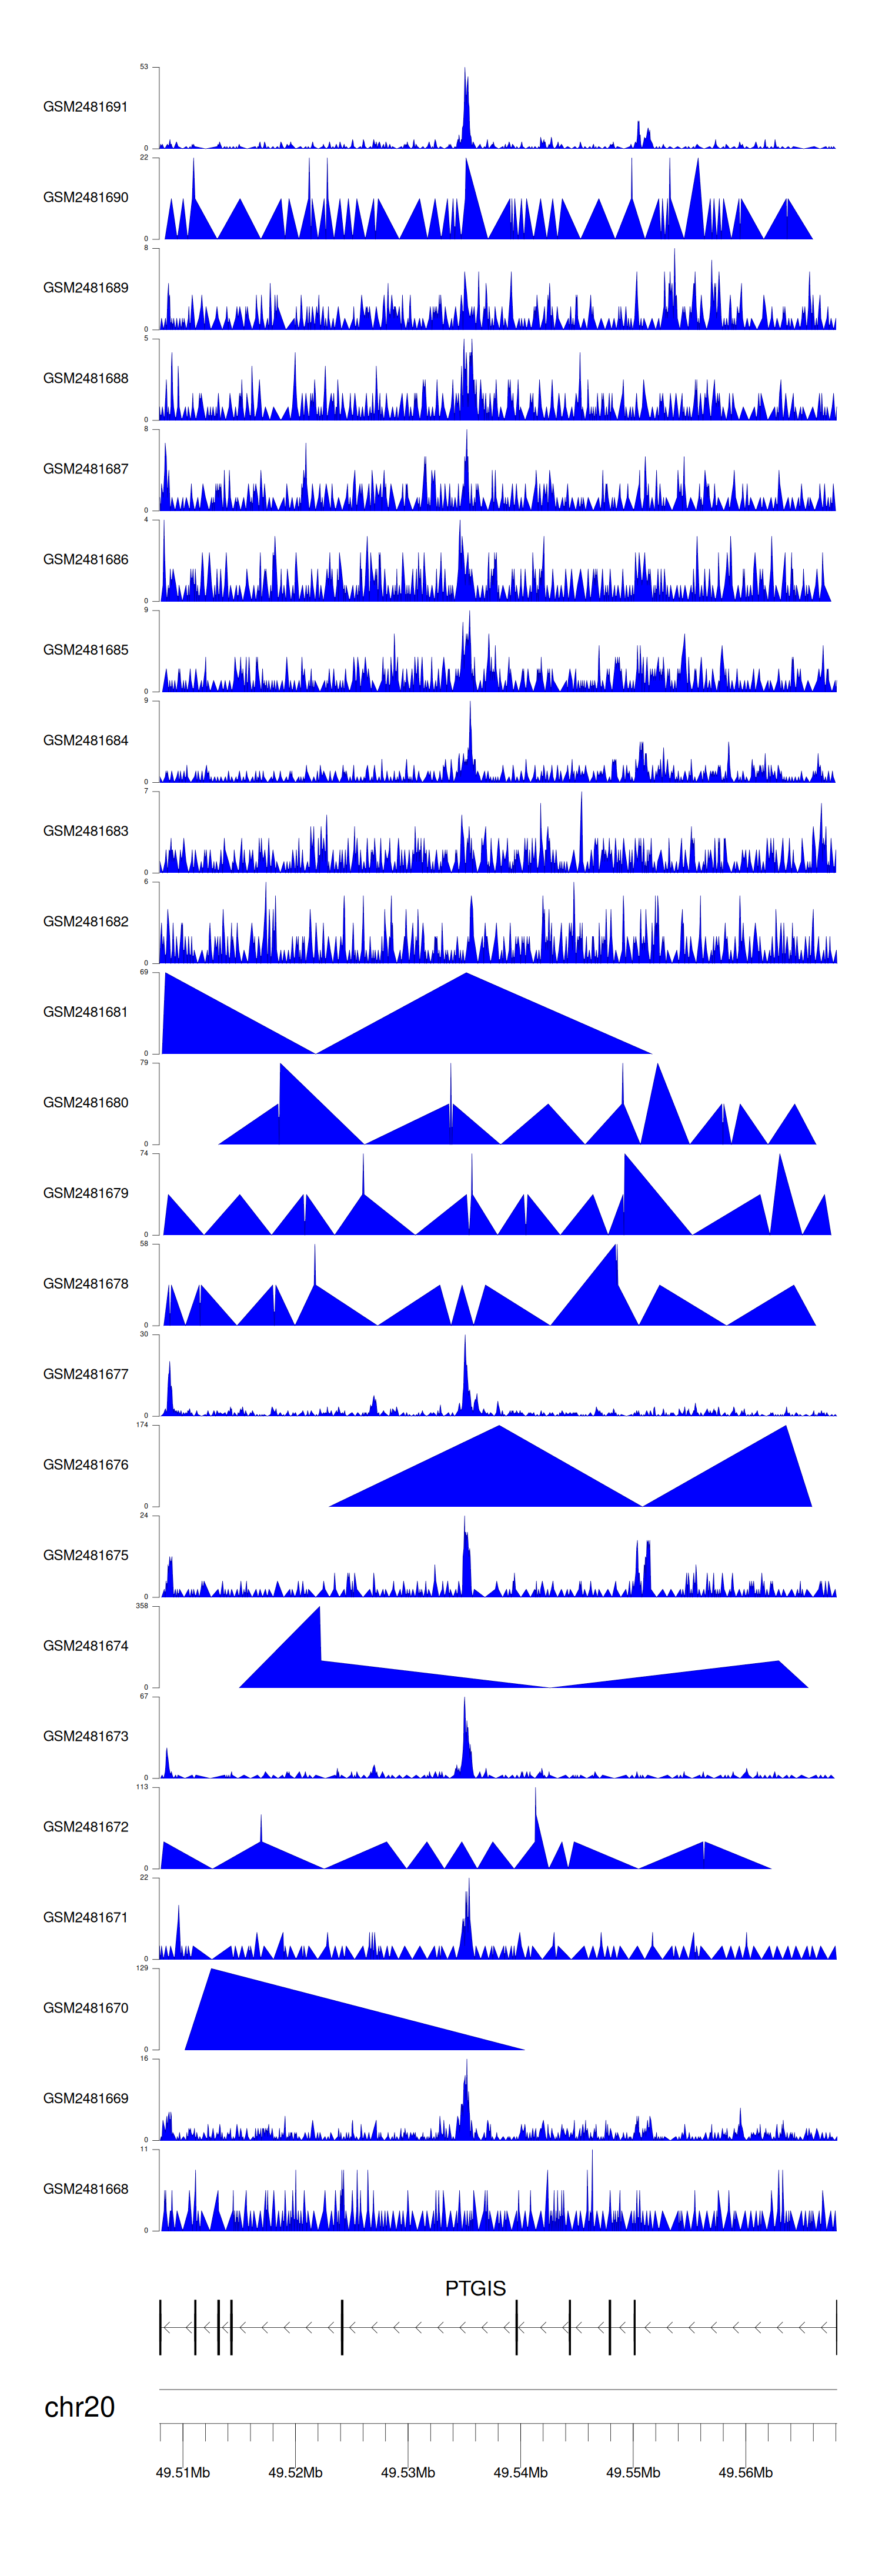
> Dataset: GSE94732 - PTGIS peak across samples
|
Peak Plot
|
|
|
