Gene Information
|
Gene Name
|
RALGAPA2 |
|
Gene ID
|
57186
|
|
Gene Full Name
|
Ral GTPase activating protein catalytic subunit alpha 2 |
|
Gene Alias
|
AS250|C20orf74|bA287B20.1|dJ1049G11|dJ1049G11.4|p220 |
|
Transcripts
|
ENSG00000188559
|
|
Virus
|
HTLV1 |
|
Gene Type
|
protein-coding |
|
HPA Location Info
|
Plasma membrane, Cytosol; 
|
|
Membrane Info
|
Predicted intracellular proteins, Predicted membrane proteins, RAS pathway related proteins |
|
Uniport_ID
|
Q2PPJ7
|
|
HGNC ID
|
HGNC:16207
|
|
OMIM ID
|
618836 |
|
Summary
|
Predicted to enable GTPase activator activity and protein heterodimerization activity. Predicted to be involved in activation of GTPase activity. Predicted to act upstream of or within Ral protein signal transduction; regulation of exocyst localization; and regulation of protein localization. Located in cytosol and plasma membrane. [provided by Alliance of Genome Resources, Apr 2025] |
Target gene [RALGAPA2] related to VISs 
Integration Table: if previous studies reported that target gene was altered by virus integration events, the overlap between VISs in this literature and Cistrome factors was listed in this section
Target gene [RALGAPA2] related to Omics data
| Data ID |
Experiment type |
Sample number |
Platform |
|
GSE189602
|
Methylation profiling (Array) |
4 |
Infinium MethylationEPIC |
|
C GSE94732
|
Chip-seq |
24 |
Illumina NextSeq 500 (Homo sapiens);illumina Genome Analyzer IIx (Homo sapiens) |
|
GSE52244
|
Expression array |
15 |
[HuEx-1_0-st] Affymetrix Human Exon 1.0 ST Array [probe set (exon) version] |
|
GSE224047
|
RNA-seq |
10 |
Illumina NextSeq 500 (Homo sapiens) |
|
GSE168557
|
Expression array |
6 |
Agilent-039494 SurePrint G3 Human GE v2 8x60K Microarray 039381 (Feature Number version) |
|
GSE136189
|
Methylation profiling (Array) |
40 |
Illumina HumanMethylation450 BeadChip (HumanMethylation450_15017482);Illumina Infinium HumanMethylation850 BeadChip |
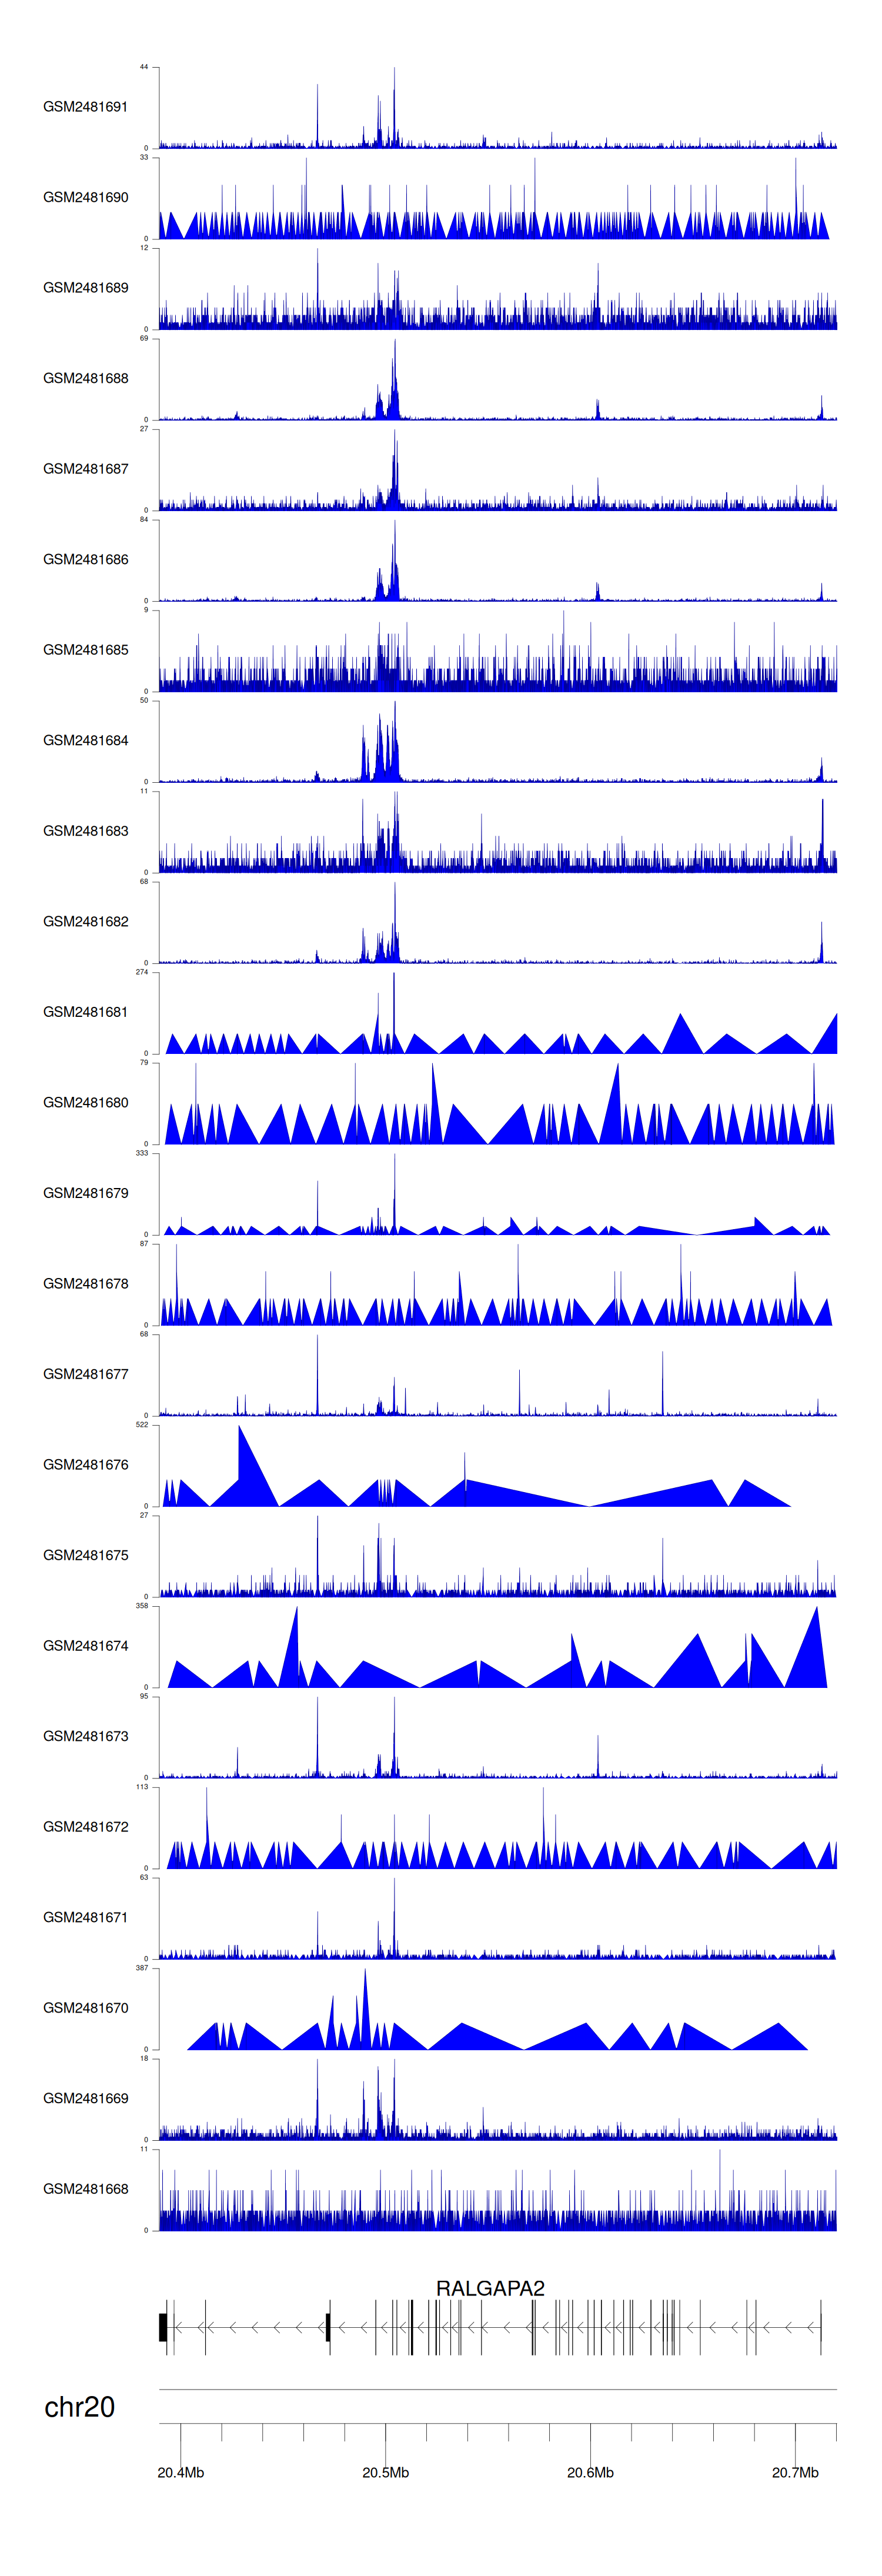
When the gene can detect a peak in the dataset, a peak plot will be displayed.
> Dataset: GSE94732 - RALGAPA2 peak across samples
|
Peak Plot
|
|
|
