Gene Information
|
Gene Name
|
SEMA5B |
|
Gene ID
|
54437
|
|
Gene Full Name
|
semaphorin 5B |
|
Gene Alias
|
SEMAG|SemG |
|
Transcripts
|
ENSG00000082684
|
|
Virus
|
HTLV1 |
|
Gene Type
|
protein-coding |
|
HPA Location Info
|
Cytosol; 
|
|
Membrane Info
|
Predicted membrane proteins |
|
Uniport_ID
|
Q9P283
|
|
HGNC ID
|
HGNC:10737
|
|
OMIM ID
|
609298 |
|
Summary
|
This gene encodes a member of the semaphorin protein family which regulates axon growth during development of the nervous system. The encoded protein has a characteristic Sema domain near the N-terminus, through which semaphorins bind to plexin, and five thrombospondin type 1 repeats in the C-terminal region of the protein. The protein product may be cleaved and exist as a secreted molecule (PMID: 19463192). Multiple transcript variants encoding different isoforms have been found for this gene. [provided by RefSeq, Jan 2012] |
Target gene [SEMA5B] related to VISs 
Integration Table: if previous studies reported that target gene was altered by virus integration events, the overlap between VISs in this literature and Cistrome factors was listed in this section
Target gene [SEMA5B] related to Omics data
| Data ID |
Experiment type |
Sample number |
Platform |
|
C GSE94732
|
Chip-seq |
24 |
Illumina NextSeq 500 (Homo sapiens);illumina Genome Analyzer IIx (Homo sapiens) |
|
GSE168557
|
Expression array |
6 |
Agilent-039494 SurePrint G3 Human GE v2 8x60K Microarray 039381 (Feature Number version) |
|
GSE52244
|
Expression array |
15 |
[HuEx-1_0-st] Affymetrix Human Exon 1.0 ST Array [probe set (exon) version] |
|
GSE10789
|
Expression array |
6 |
NCI/ATC Hs-OperonV3 |
|
GSE189602
|
Methylation profiling (Array) |
4 |
Infinium MethylationEPIC |
|
GSE136189
|
Methylation profiling (Array) |
40 |
Illumina HumanMethylation450 BeadChip (HumanMethylation450_15017482);Illumina Infinium HumanMethylation850 BeadChip |
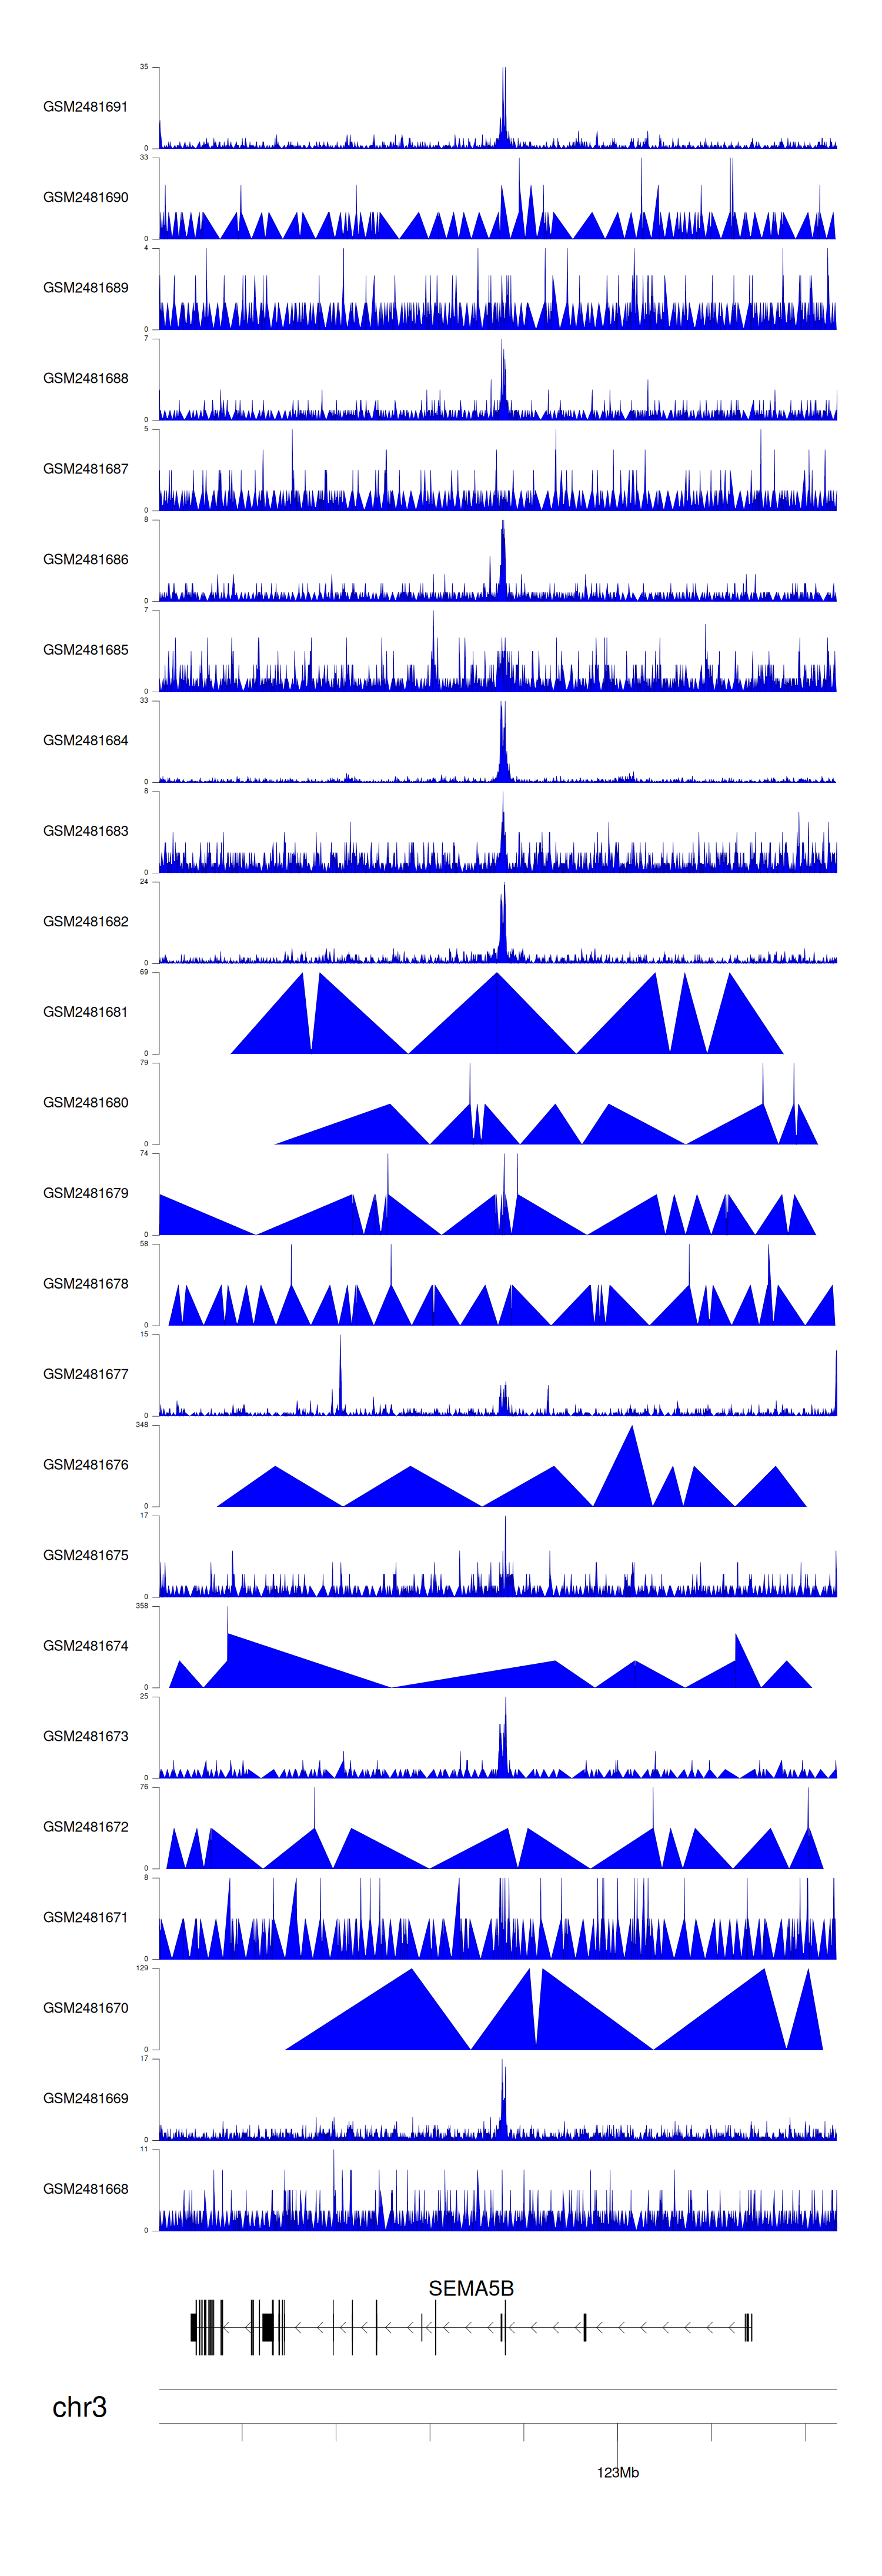
When the gene can detect a peak in the dataset, a peak plot will be displayed.
> Dataset: GSE94732 - SEMA5B peak across samples
|
Peak Plot
|
|
|
