Gene Information
|
Gene Name
|
SETBP1 |
|
Gene ID
|
26040
|
|
Gene Full Name
|
SET binding protein 1 |
|
Gene Alias
|
MRD29|SEB |
|
Transcripts
|
ENSG00000152217
|
|
Virus
|
HTLV1 |
|
Gene Type
|
protein-coding |
|
HPA Location Info
|
Nucleoplasm;Nuclear bodies, Cytosol; 
|
|
Membrane Info
|
Cancer-related genes, Disease related genes, Human disease related genes, Predicted intracellular proteins |
|
Uniport_ID
|
Q9Y6X0
|
|
HGNC ID
|
HGNC:15573
|
|
OMIM ID
|
611060 |
|
Summary
|
This gene encodes a protein which contains a several motifs including a ski homology region and a SET-binding region in addition to three nuclear localization signals. The encoded protein has been shown to bind the SET nuclear oncogene which is involved in DNA replication. Mutations in this gene are associated with Schinzel-Giedion midface retraction syndrome. Multiple transcript variants encoding different isoforms have been found for this gene. [provided by RefSeq, Aug 2011] |
Target gene [SETBP1] related to VISs 
Integration Table: if previous studies reported that target gene was altered by virus integration events, the overlap between VISs in this literature and Cistrome factors was listed in this section
Target gene [SETBP1] related to Omics data
| Data ID |
Experiment type |
Sample number |
Platform |
|
GSE189602
|
Methylation profiling (Array) |
4 |
Infinium MethylationEPIC |
|
C GSE94732
|
Chip-seq |
24 |
Illumina NextSeq 500 (Homo sapiens);illumina Genome Analyzer IIx (Homo sapiens) |
|
GSE52244
|
Expression array |
15 |
[HuEx-1_0-st] Affymetrix Human Exon 1.0 ST Array [probe set (exon) version] |
|
GSE10789
|
Expression array |
6 |
NCI/ATC Hs-OperonV3 |
|
GSE224047
|
RNA-seq |
10 |
Illumina NextSeq 500 (Homo sapiens) |
|
GSE168557
|
Expression array |
6 |
Agilent-039494 SurePrint G3 Human GE v2 8x60K Microarray 039381 (Feature Number version) |
|
GSE136189
|
Methylation profiling (Array) |
40 |
Illumina HumanMethylation450 BeadChip (HumanMethylation450_15017482);Illumina Infinium HumanMethylation850 BeadChip |
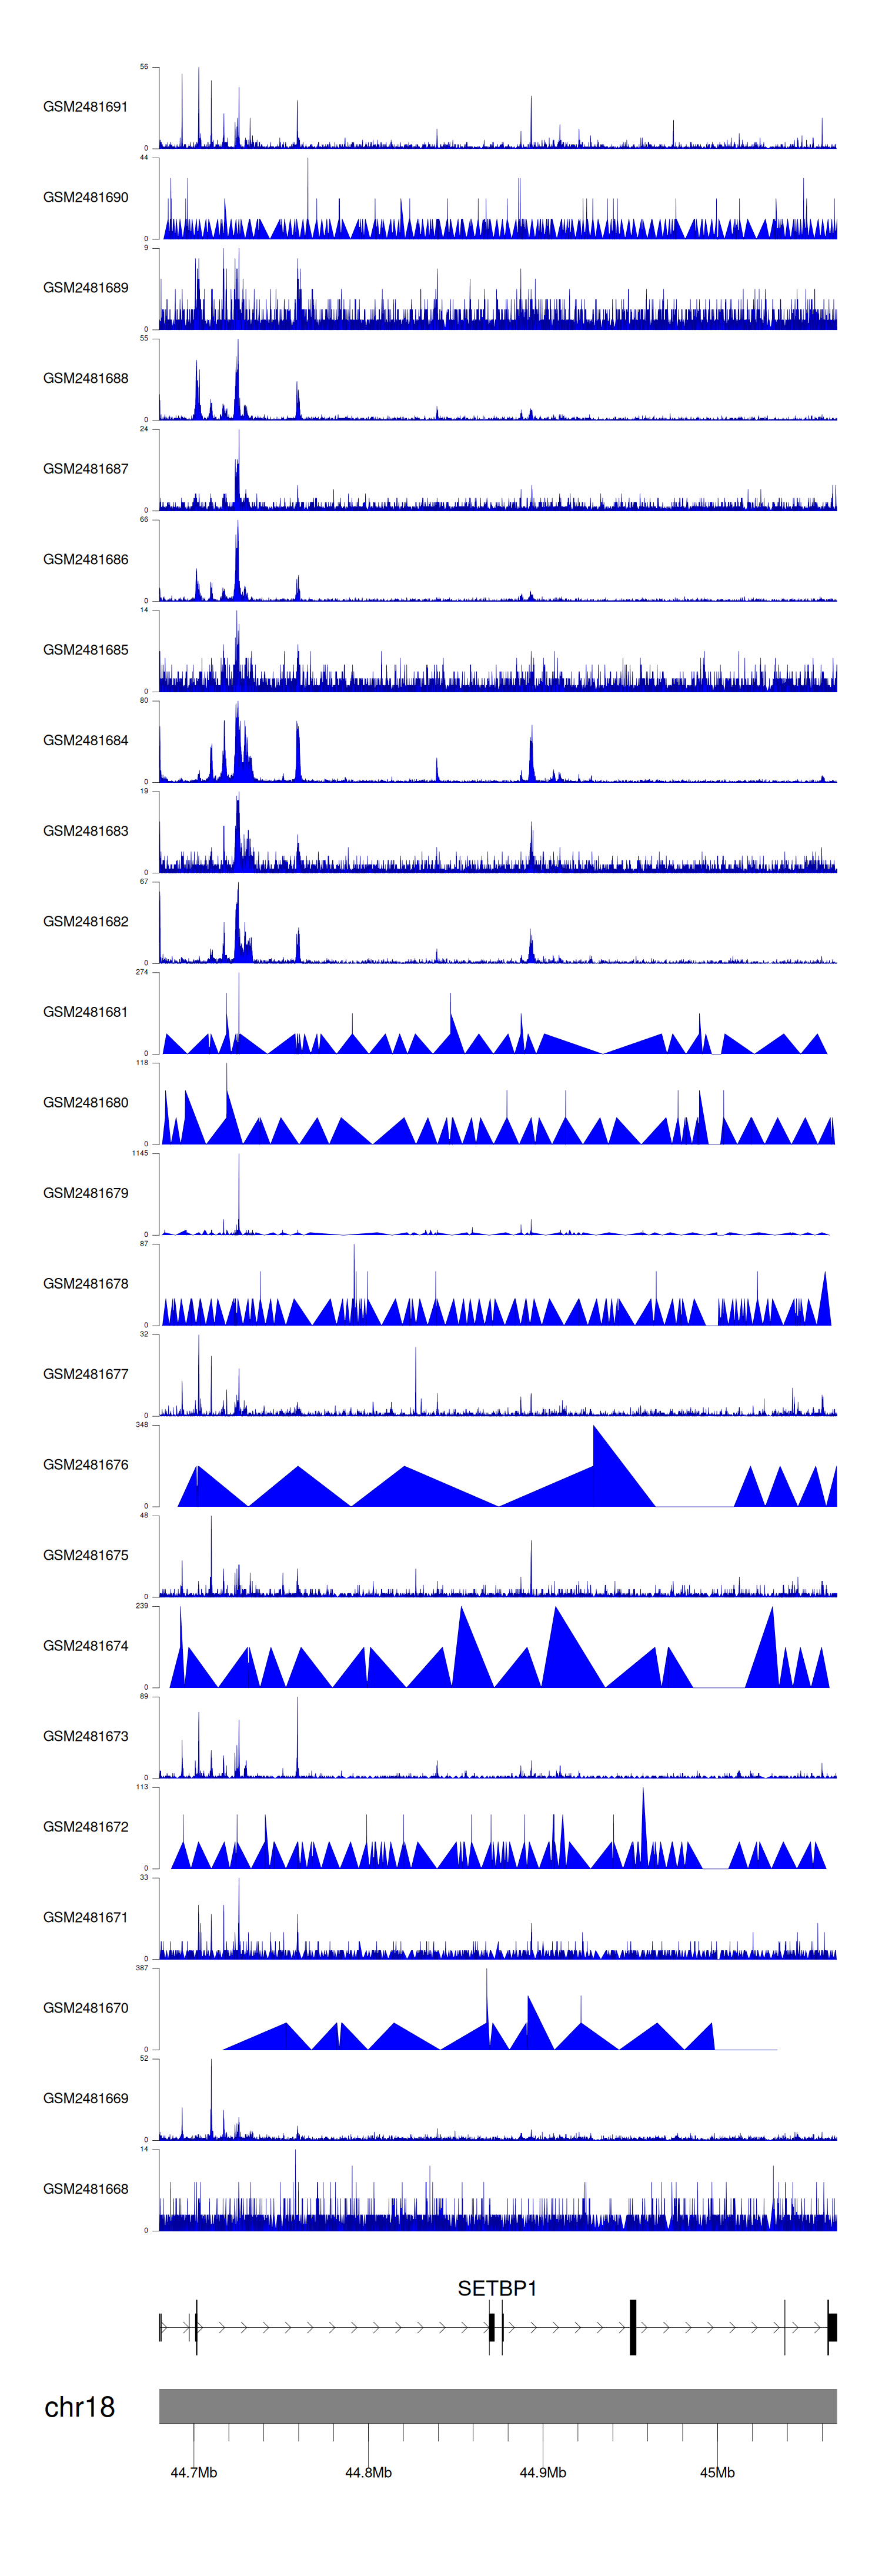
When the gene can detect a peak in the dataset, a peak plot will be displayed.
> Dataset: GSE94732 - SETBP1 peak across samples
|
Peak Plot
|
|
|
