Gene Information
|
Gene Name
|
SGCE |
|
Gene ID
|
8910
|
|
Gene Full Name
|
sarcoglycan epsilon |
|
Gene Alias
|
DYT11|ESG|epsilon-SG |
|
Transcripts
|
ENSG00000127990
|
|
Virus
|
HTLV1 |
|
Gene Type
|
protein-coding |
|
HPA Location Info
|
Vesicles, Plasma membrane;Nucleoplasm, Golgi apparatus; 
|
|
Membrane Info
|
Disease related genes, Human disease related genes, Predicted intracellular proteins, Predicted membrane proteins |
|
Uniport_ID
|
O43556
|
|
HGNC ID
|
HGNC:10808
|
|
OMIM ID
|
604149 |
|
Summary
|
This gene encodes the epsilon member of the sarcoglycan family. Sarcoglycans are transmembrane proteins that are components of the dystrophin-glycoprotein complex, which link the actin cytoskeleton to the extracellular matrix. Unlike other family members which are predominantly expressed in striated muscle, the epsilon sarcoglycan is more broadly expressed. Mutations in this gene are associated with myoclonus-dystonia syndrome. This gene is imprinted, with preferential expression from the paternal allele. Alternatively spliced transcript variants encoding different isoforms have been found for this gene. A pseudogene associated with this gene is located on chromosome 2. [provided by RefSeq, Oct 2016] |
Target gene [SGCE] related to VISs 
Integration Table: if previous studies reported that target gene was altered by virus integration events, the overlap between VISs in this literature and Cistrome factors was listed in this section
| DVID |
Chromosome |
HM |
TFBS |
CA |
Sum of Overlapped Records |
Detail |
| 6017619 |
chr7 |
8 |
2 |
0 |
10 |
View |
Target gene [SGCE] related to Omics data
| Data ID |
Experiment type |
Sample number |
Platform |
|
C GSE94732
|
Chip-seq |
24 |
Illumina NextSeq 500 (Homo sapiens);illumina Genome Analyzer IIx (Homo sapiens) |
|
GSE168557
|
Expression array |
6 |
Agilent-039494 SurePrint G3 Human GE v2 8x60K Microarray 039381 (Feature Number version) |
|
GSE52244
|
Expression array |
15 |
[HuEx-1_0-st] Affymetrix Human Exon 1.0 ST Array [probe set (exon) version] |
|
GSE10789
|
Expression array |
6 |
NCI/ATC Hs-OperonV3 |
|
GSE189602
|
Methylation profiling (Array) |
4 |
Infinium MethylationEPIC |
|
GSE136189
|
Methylation profiling (Array) |
40 |
Illumina HumanMethylation450 BeadChip (HumanMethylation450_15017482);Illumina Infinium HumanMethylation850 BeadChip |
When the gene can detect a peak in the dataset, a peak plot will be displayed.
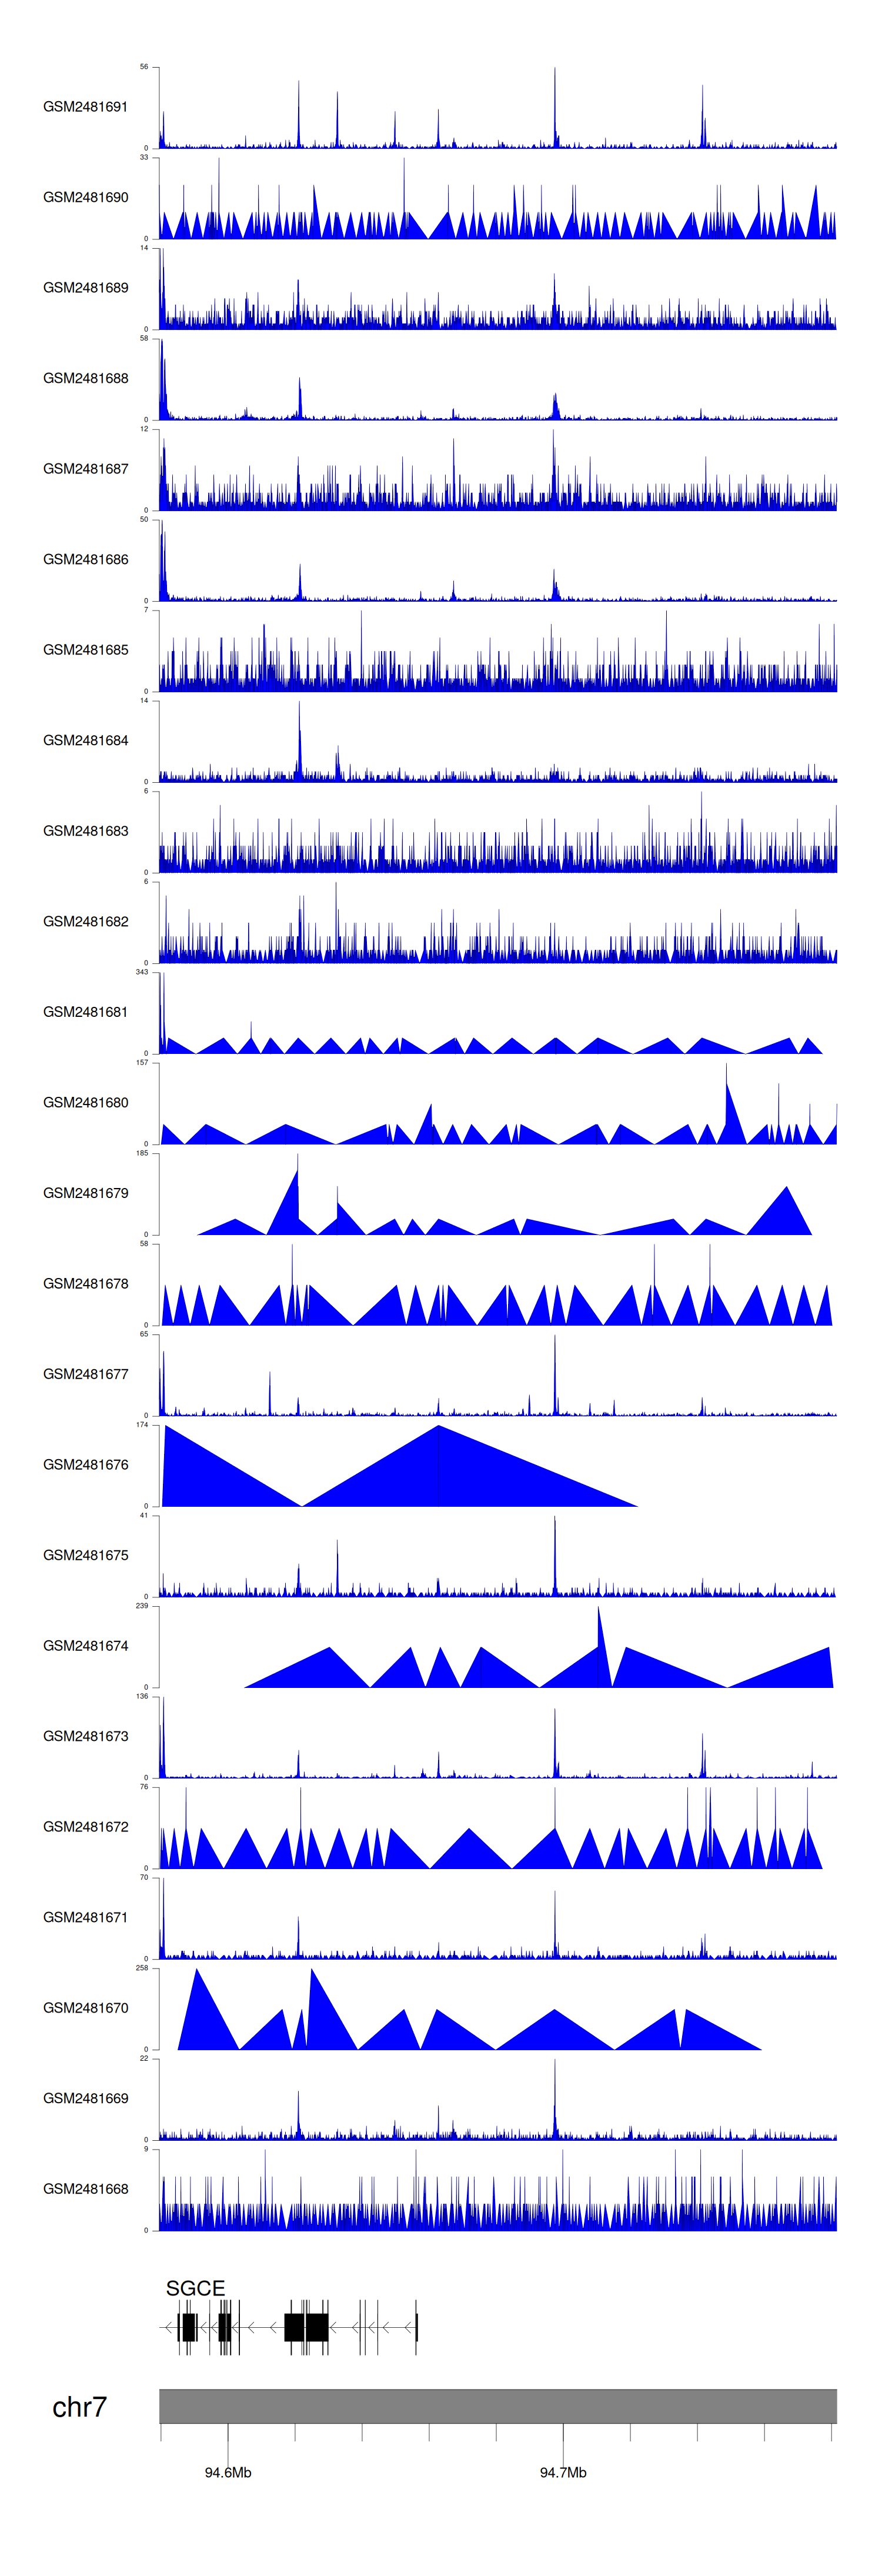
> Dataset: GSE94732 - SGCE peak across samples
|
Peak Plot
|
|
|
