Gene Information
|
Gene Name
|
SIPA1L3 |
|
Gene ID
|
23094
|
|
Gene Full Name
|
signal induced proliferation associated 1 like 3 |
|
Gene Alias
|
CTRCT45|SPAL3|SPAR3 |
|
Transcripts
|
ENSG00000105738
|
|
Virus
|
HBV |
|
Gene Type
|
protein-coding |
|
HPA Location Info
|
Plasma membrane;Nucleoplasm, Golgi apparatus; 
|
|
Membrane Info
|
Disease related genes, Human disease related genes, Predicted intracellular proteins |
|
Uniport_ID
|
O60292
|
|
HGNC ID
|
HGNC:23801
|
|
OMIM ID
|
616655 |
|
Summary
|
This gene belongs to the signal induced proliferation associated 1 family of genes, which encode GTPase-activating proteins specific for the GTP-binding protein Rap1. Rap1 has been implicated in regulation of cell adhesion, cell polarity, and organization of the cytoskeleton. Like other members of the family, the protein encoded by this gene contains RapGAP and PDZ domains. In addition, this protein contains a C-terminal leucine zipper domain. This gene is proposed to function in epithelial cell morphogenesis and establishment or maintenance of polarity. Consistently, expression of the protein in cell culture showed localization to cell-cell borders in apical regions, and downregulation of the gene in 3D Caco2 cell culture resulted in abnormal cell polarity and morphogenesis. Allelic variants of this gene have been associated with congenital cataracts in humans. [provided by RefSeq, Feb 2016] |
Target gene [SIPA1L3] related to VISs 
Integration Table: if previous studies reported that target gene was altered by virus integration events, the overlap between VISs in this literature and Cistrome factors was listed in this section
| DVID |
Chromosome |
HM |
TFBS |
CA |
Sum of Overlapped Records |
Detail |
| 1001813 |
chr19 |
374 |
65 |
32 |
471 |
View |
| 1005181 |
chr19 |
50 |
6 |
3 |
59 |
View |
| 1041254 |
chr19 |
20 |
1 |
0 |
21 |
View |
Target gene [SIPA1L3] related to Omics data
| Data ID |
Experiment type |
Sample number |
Platform |
|
GSE236281
|
RNA-seq |
12 |
Illumina MiSeq (Homo sapiens) |
|
C GSE35465
|
Chip-seq;RNA-seq |
6 |
Illumina HiSeq 2000 (Homo sapiens) |
|
C GSE68402
|
Chip-seq |
26 |
Illumina MiSeq (Homo sapiens);Illumina HiSeq 2500 (Homo sapiens) |
|
S GSE247322
|
scRNA-seq |
27 |
Illumina NovaSeq 6000 (Homo sapiens) |
|
TCGA_LIHC_HBV
|
DNA methylation sequencing;RNA-seq |
97 |
TCGA |
|
C GSE270130
|
Chip-seq |
27 |
Illumina NovaSeq 6000 (Homo sapiens) |
|
GSE224901
|
RNA-seq |
21 |
Illumina NovaSeq 6000 (Homo sapiens) |
|
C GSE100400
|
Chip-seq;RNA-seq;4C_cccDNA |
31 |
Illumina NextSeq 500 (Homo sapiens);Illumina NextSeq 500 (Mus musculus) |
|
GSE173897
|
RNA-seq |
95 |
Illumina HiSeq 4000 (Homo sapiens) |
|
GSE262515
|
RNA-seq |
21 |
Illumina HiSeq 2500 (Homo sapiens);Illumina HiSeq 2500 (Mus musculus) |
|
GSE110345
|
RNA-seq |
4 |
Illumina HiSeq 2500 (Homo sapiens) |
|
C GSE131257
|
ATAC-seq;RNA-seq |
19 |
Illumina HiSeq 2500 (Homo sapiens) |
|
E GSE94660
|
RNA-seq |
42 |
Illumina HiSeq 2500 (Homo sapiens) |
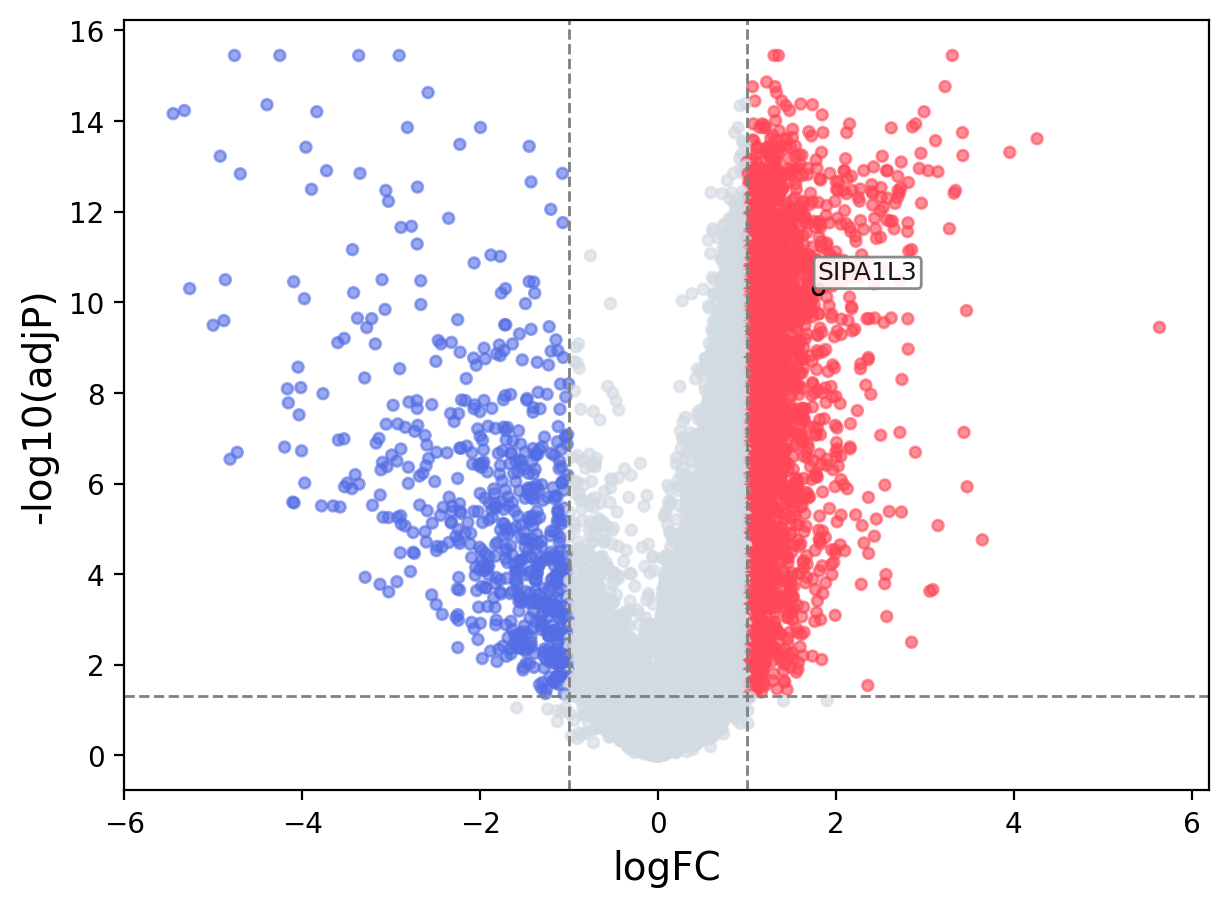
When the query gene is differentially changed in the dataset, a volcano/bar plot will be displayed.
> Dataset: GSE94660 - SIPA1L3 expression across samples
|
Volcano Plot
|
Bar Plot
|
|
|
