Gene Information
|
Gene Name
|
SLC17A4 |
|
Gene ID
|
10050
|
|
Gene Full Name
|
solute carrier family 17 member 4 |
|
Gene Alias
|
KAIA2138 |
|
Transcripts
|
ENSG00000146039
|
|
Virus
|
HTLV1 |
|
Gene Type
|
protein-coding |
|
HPA Location Info
|

|
|
Membrane Info
|
Metabolic proteins, Predicted membrane proteins, Transporters |
|
Uniport_ID
|
Q9Y2C5
|
|
HGNC ID
|
HGNC:10932
|
|
OMIM ID
|
604216 |
|
Summary
|
Phosphate homeostasis is maintained by regulating intake, intestinal absorption, bone deposition and resorption, and renal excretion of phosphate. The central molecule in the control of phosphate excretion from the kidney is the sodium/phosphate cotransporter NPT1 (SLC17A1; MIM 182308), which is located in the renal proximal tubule. NPT1 uses the transmembrane electrochemical potential gradient of sodium to transport phosphate across the cell membrane. SLC17A4 is a similar sodium/phosphate cotransporter in the intestinal mucosa that plays an important role in the absorption of phosphate from the intestine (summary by Shibui et al., 1999 [PubMed 10319585]).[supplied by OMIM, Feb 2011] |
Target gene [SLC17A4] related to VISs 
Integration Table: if previous studies reported that target gene was altered by virus integration events, the overlap between VISs in this literature and Cistrome factors was listed in this section
| DVID |
Chromosome |
HM |
TFBS |
CA |
Sum of Overlapped Records |
Detail |
| 6003385 |
chr6 |
48 |
75 |
40 |
163 |
View |
Target gene [SLC17A4] related to Omics data
| Data ID |
Experiment type |
Sample number |
Platform |
|
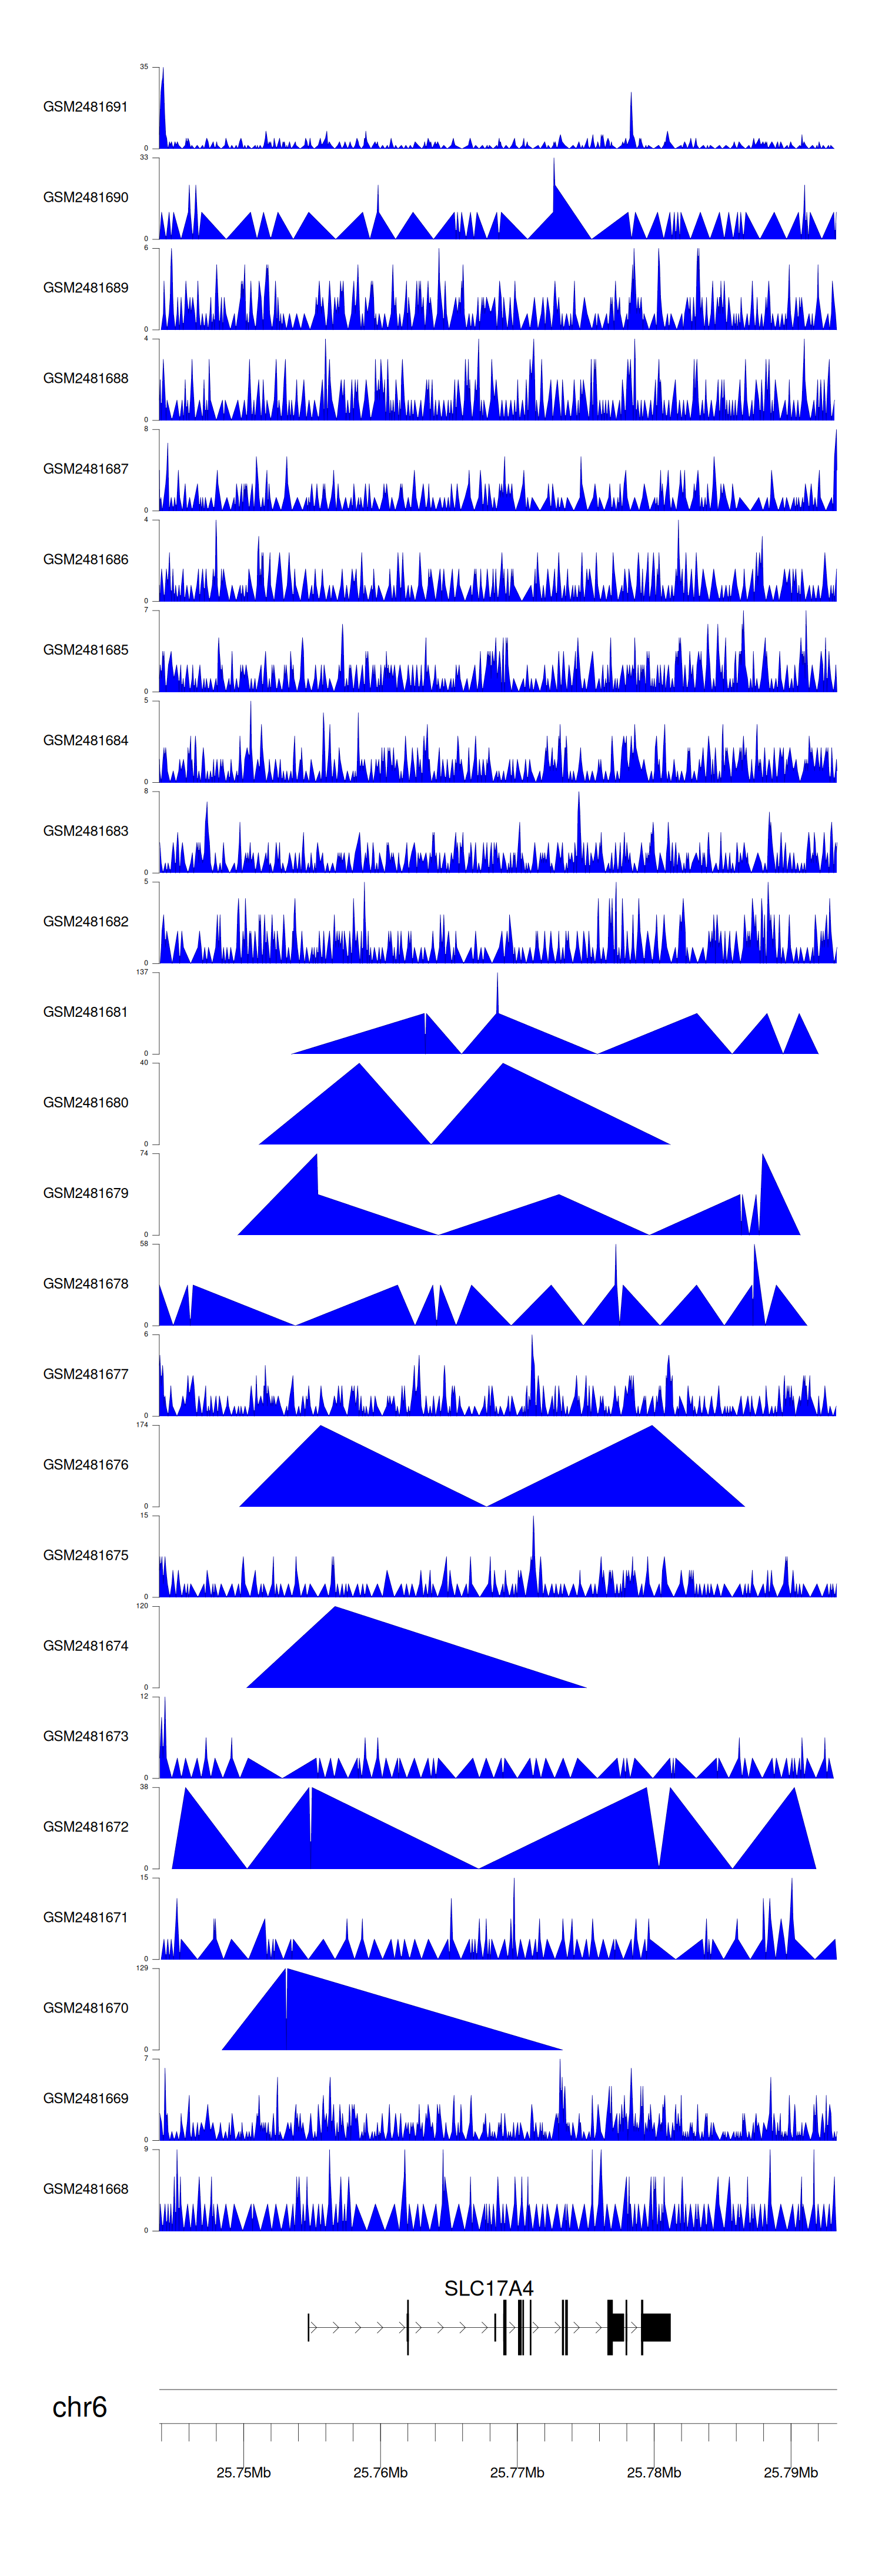
C GSE94732
|
Chip-seq |
24 |
Illumina NextSeq 500 (Homo sapiens);illumina Genome Analyzer IIx (Homo sapiens) |
|
GSE168557
|
Expression array |
6 |
Agilent-039494 SurePrint G3 Human GE v2 8x60K Microarray 039381 (Feature Number version) |
|
GSE52244
|
Expression array |
15 |
[HuEx-1_0-st] Affymetrix Human Exon 1.0 ST Array [probe set (exon) version] |
|
GSE10789
|
Expression array |
6 |
NCI/ATC Hs-OperonV3 |
|
GSE189602
|
Methylation profiling (Array) |
4 |
Infinium MethylationEPIC |
|
M GSE136189
|
Methylation profiling (Array) |
40 |
Illumina HumanMethylation450 BeadChip (HumanMethylation450_15017482);Illumina Infinium HumanMethylation850 BeadChip |
When the query gene is differentially changed in the dataset, a volcano/bar plot will be displayed.
> Dataset: GSE94732 - SLC17A4 peak across samples
|
Peak Plot
|
|
|
