Gene Information
|
Gene Name
|
SLC25A13 |
|
Gene ID
|
10165
|
|
Gene Full Name
|
solute carrier family 25 member 13 |
|
Gene Alias
|
ARALAR2|CITRIN|CTLN2|NICCD |
|
Transcripts
|
ENSG00000004864
|
|
Virus
|
HBV |
|
Gene Type
|
protein-coding |
|
HPA Location Info
|
Mitochondria; 
|
|
Membrane Info
|
Disease related genes, Human disease related genes, Metabolic proteins, Plasma proteins, Potential drug targets, Predicted intracellular proteins, Transporters |
|
Uniport_ID
|
Q9UJS0
|
|
HGNC ID
|
HGNC:10983
|
|
OMIM ID
|
603859 |
|
Summary
|
This gene is a member of the mitochondrial carrier family. The encoded protein contains four EF-hand Ca(2+) binding motifs in the N-terminal domain, and localizes to mitochondria. The protein catalyzes the exchange of aspartate for glutamate and a proton across the inner mitochondrial membrane, and is stimulated by calcium on the external side of the inner mitochondrial membrane. Mutations in this gene result in citrullinemia, type II. Multiple transcript variants encoding different isoforms have been found for this gene. [provided by RefSeq, May 2009] |
Target gene [SLC25A13] related to VISs 
Integration Table: if previous studies reported that target gene was altered by virus integration events, the overlap between VISs in this literature and Cistrome factors was listed in this section
| DVID |
Chromosome |
HM |
TFBS |
CA |
Sum of Overlapped Records |
Detail |
| 1041544 |
chr7 |
3 |
0 |
0 |
3 |
View |
Target gene [SLC25A13] related to Omics data
| Data ID |
Experiment type |
Sample number |
Platform |
|
GSE236281
|
RNA-seq |
12 |
Illumina MiSeq (Homo sapiens) |
|
C GSE35465
|
Chip-seq;RNA-seq |
6 |
Illumina HiSeq 2000 (Homo sapiens) |
|
GSE199850
|
scRNA-seq |
1 |
HiSeq X Ten (Homo sapiens) |
|
C GSE68402
|
Chip-seq |
26 |
Illumina MiSeq (Homo sapiens);Illumina HiSeq 2500 (Homo sapiens) |
|
GSE247322
|
scRNA-seq |
27 |
Illumina NovaSeq 6000 (Homo sapiens) |
|
TCGA_LIHC_HBV
|
DNA methylation sequencing;RNA-seq |
97 |
TCGA |
|
C GSE270130
|
Chip-seq |
27 |
Illumina NovaSeq 6000 (Homo sapiens) |
|
GSE224901
|
RNA-seq |
21 |
Illumina NovaSeq 6000 (Homo sapiens) |
|
GSE100400
|
Chip-seq;RNA-seq;4C_cccDNA |
31 |
Illumina NextSeq 500 (Homo sapiens);Illumina NextSeq 500 (Mus musculus) |
|
GSE173897
|
RNA-seq |
95 |
Illumina HiSeq 4000 (Homo sapiens) |
|
GSE262515
|
RNA-seq |
21 |
Illumina HiSeq 2500 (Homo sapiens);Illumina HiSeq 2500 (Mus musculus) |
|
GSE110345
|
RNA-seq |
4 |
Illumina HiSeq 2500 (Homo sapiens) |
|
C GSE131257
|
ATAC-seq;RNA-seq |
19 |
Illumina HiSeq 2500 (Homo sapiens) |
|
GSE94660
|
RNA-seq |
42 |
Illumina HiSeq 2500 (Homo sapiens) |
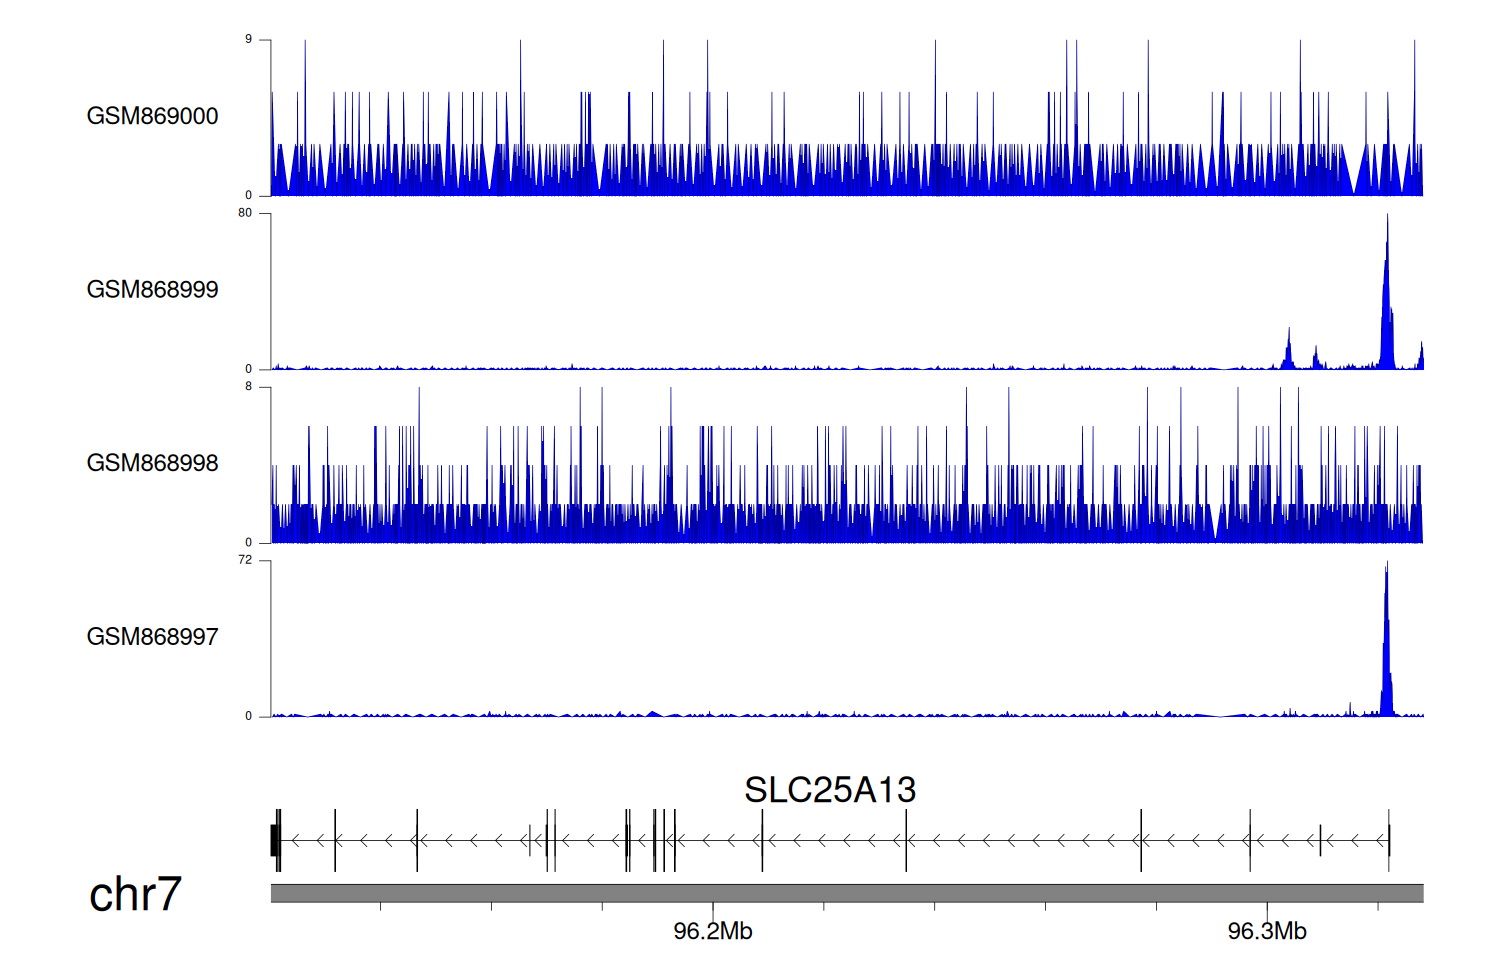
When the gene can detect a peak in the dataset, a peak plot will be displayed.
> Dataset: GSE35465 - SLC25A13 peak across samples
|
Peak Plot
|
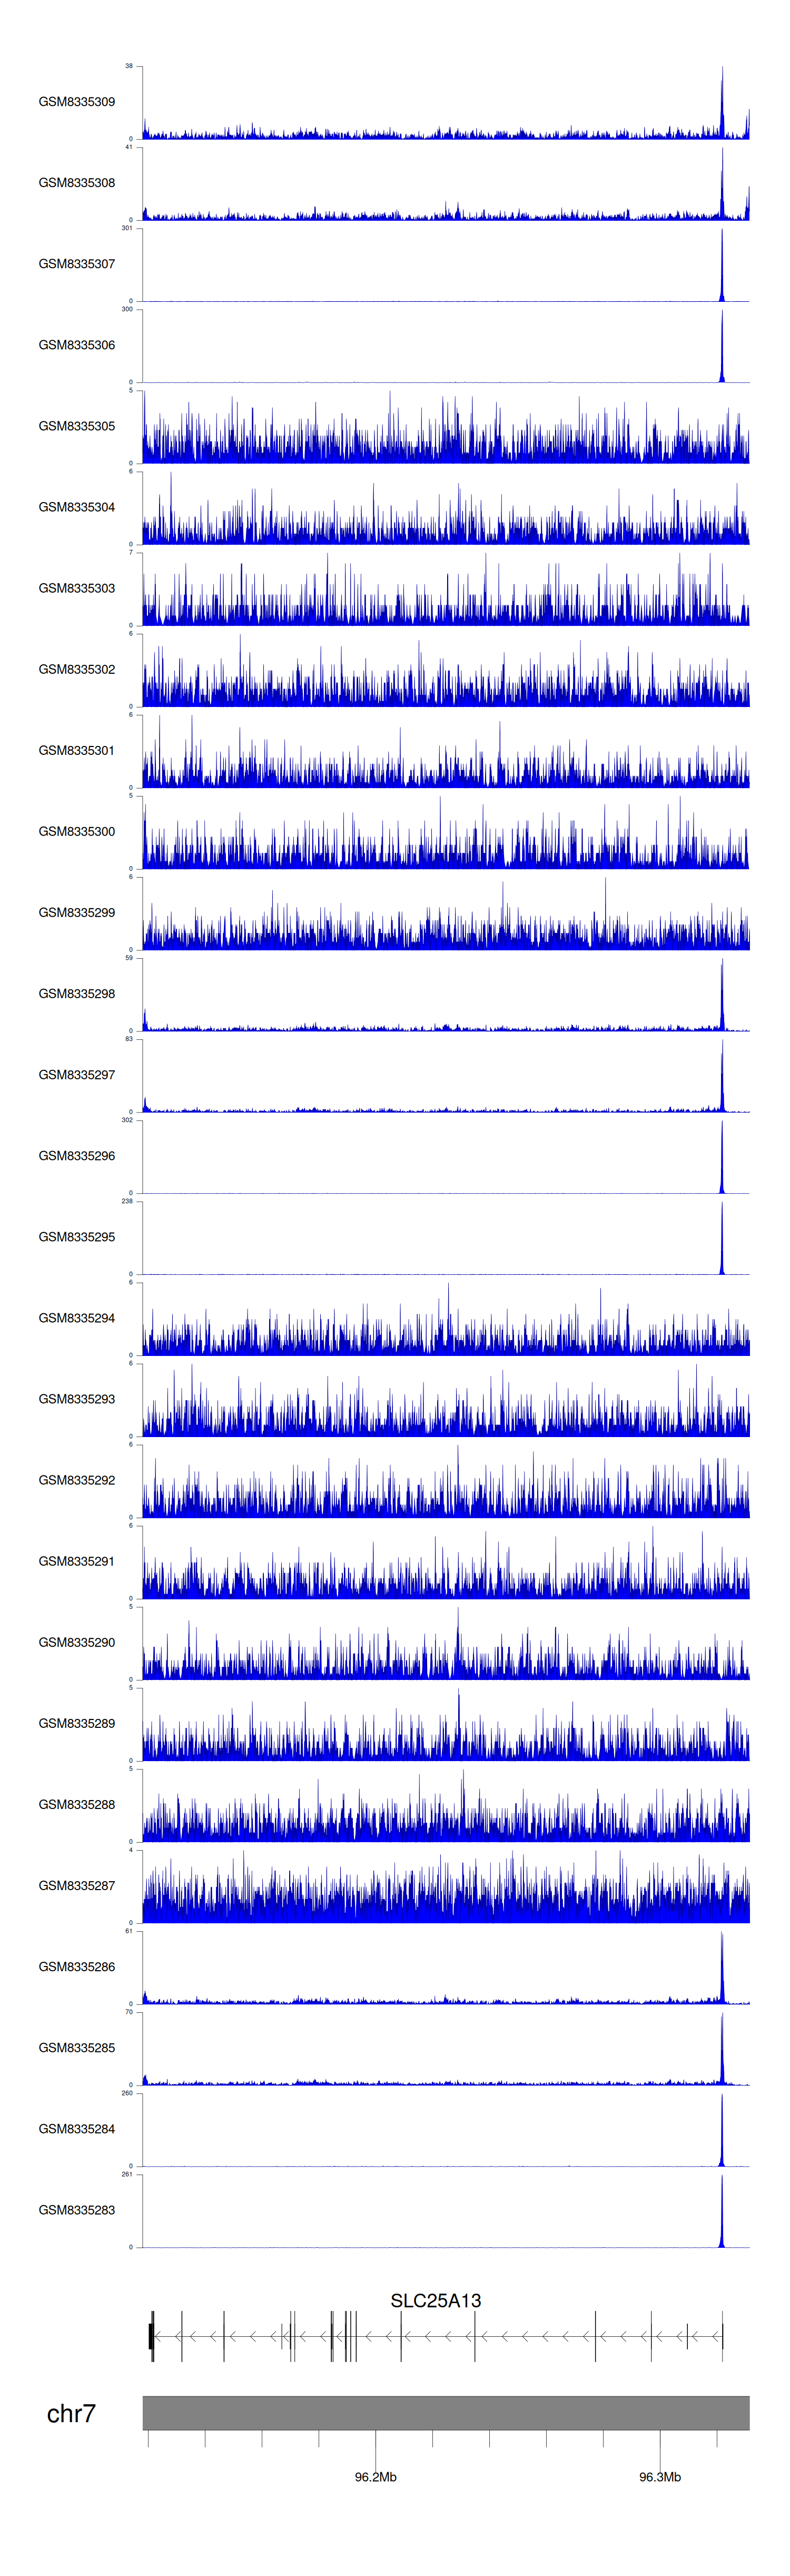
> Dataset: GSE68402 - SLC25A13 peak across samples
|
Peak Plot
|
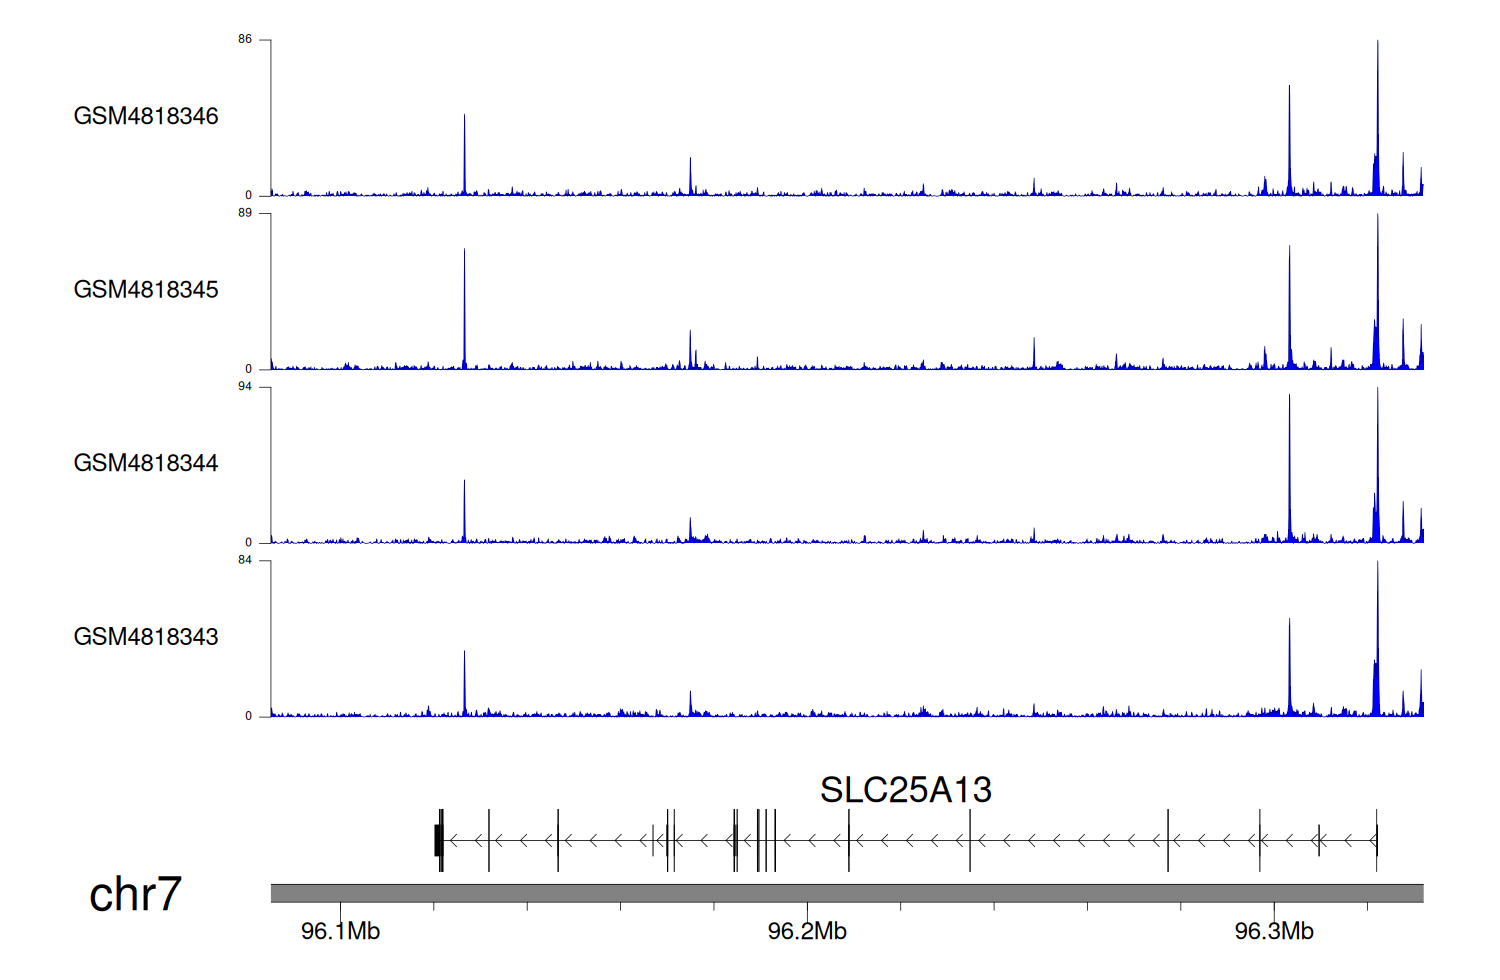
> Dataset: GSE270130 - SLC25A13 peak across samples
|
Peak Plot
|
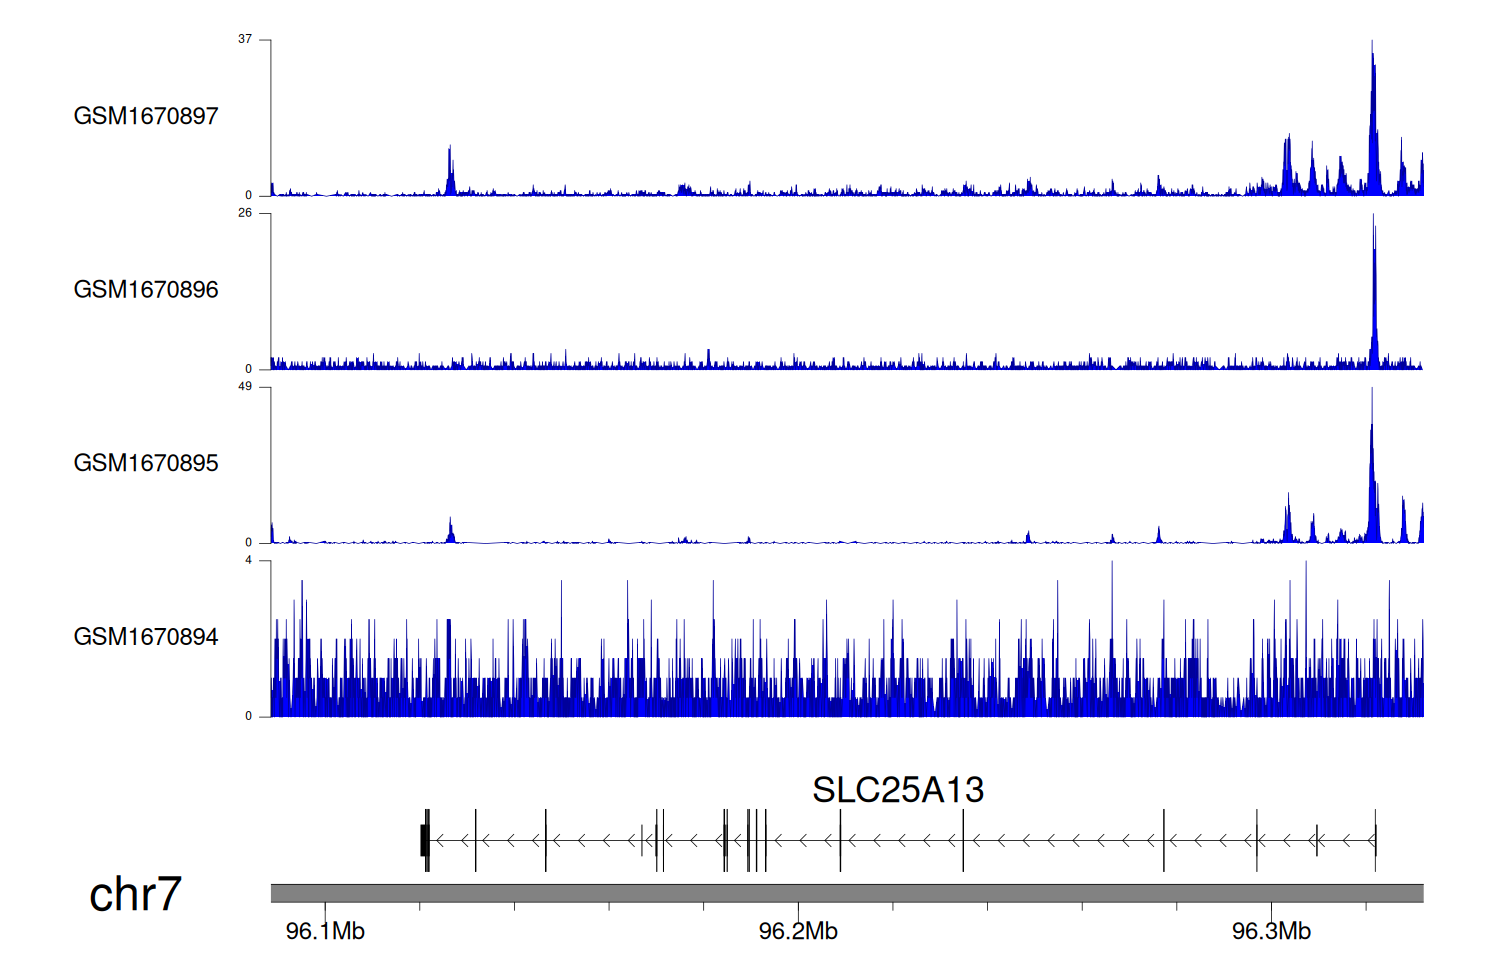
> Dataset: GSE131257 - SLC25A13 peak across samples
|
Peak Plot
|
|
|
