Gene Information
|
Gene Name
|
SLC5A2 |
|
Gene ID
|
6524
|
|
Gene Full Name
|
solute carrier family 5 member 2 |
|
Gene Alias
|
SGLT2 |
|
Transcripts
|
ENSG00000140675
|
|
Virus
|
HTLV1 |
|
Gene Type
|
protein-coding |
|
HPA Location Info
|

|
|
Membrane Info
|
Disease related genes, FDA approved drug targets, Human disease related genes, Metabolic proteins, Predicted membrane proteins, Transporters |
|
Uniport_ID
|
P31639
|
|
HGNC ID
|
HGNC:11037
|
|
OMIM ID
|
182381 |
|
Summary
|
This gene encodes a member of the sodium glucose cotransporter family which are sodium-dependent glucose transport proteins. The encoded protein is the major cotransporter involved in glucose reabsorption in the kidney. Mutations in this gene are associated with renal glucosuria. Two transcript variants, one protein-coding and one not, have been found for this gene. [provided by RefSeq, Feb 2015] |
Target gene [SLC5A2] related to VISs 
Integration Table: if previous studies reported that target gene was altered by virus integration events, the overlap between VISs in this literature and Cistrome factors was listed in this section
| DVID |
Chromosome |
HM |
TFBS |
CA |
Sum of Overlapped Records |
Detail |
| 6000585 |
chr16 |
946 |
161 |
76 |
1183 |
View |
Target gene [SLC5A2] related to Omics data
| Data ID |
Experiment type |
Sample number |
Platform |
|
C GSE94732
|
Chip-seq |
24 |
Illumina NextSeq 500 (Homo sapiens);illumina Genome Analyzer IIx (Homo sapiens) |
|
GSE168557
|
Expression array |
6 |
Agilent-039494 SurePrint G3 Human GE v2 8x60K Microarray 039381 (Feature Number version) |
|
GSE52244
|
Expression array |
15 |
[HuEx-1_0-st] Affymetrix Human Exon 1.0 ST Array [probe set (exon) version] |
|
GSE10789
|
Expression array |
6 |
NCI/ATC Hs-OperonV3 |
|
GSE189602
|
Methylation profiling (Array) |
4 |
Infinium MethylationEPIC |
|
GSE136189
|
Methylation profiling (Array) |
40 |
Illumina HumanMethylation450 BeadChip (HumanMethylation450_15017482);Illumina Infinium HumanMethylation850 BeadChip |
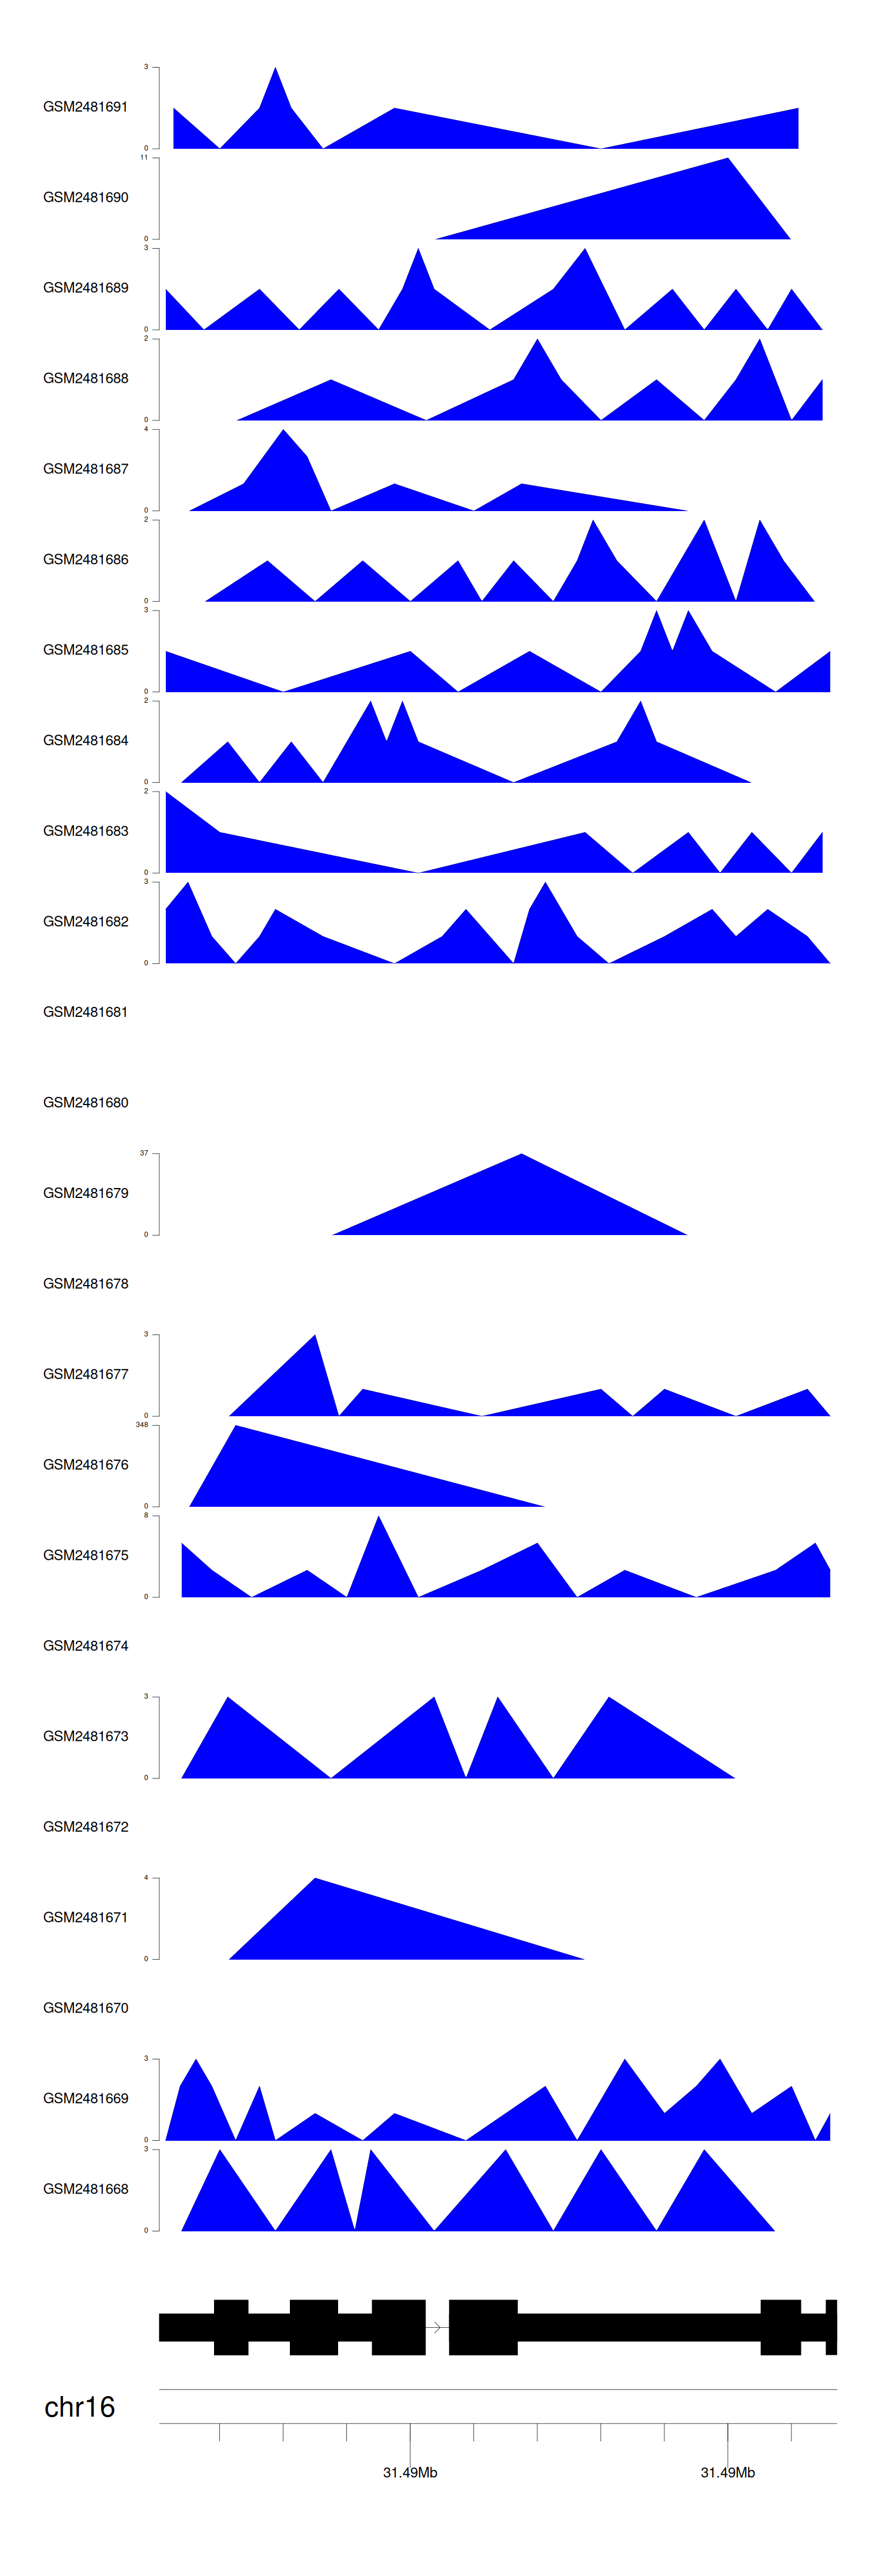
When the gene can detect a peak in the dataset, a peak plot will be displayed.
> Dataset: GSE94732 - SLC5A2 peak across samples
|
Peak Plot
|
|
|
