Gene Information
|
Gene Name
|
SLC9A9 |
|
Gene ID
|
285195
|
|
Gene Full Name
|
solute carrier family 9 member A9 |
|
Gene Alias
|
AUTS16|NHE9 |
|
Transcripts
|
ENSG00000181804
|
|
Virus
|
HTLV1 |
|
Gene Type
|
protein-coding |
|
HPA Location Info
|

|
|
Membrane Info
|
Disease related genes, Human disease related genes, Metabolic proteins, Potential drug targets, Predicted membrane proteins, Transporters |
|
Uniport_ID
|
Q8IVB4
|
|
HGNC ID
|
HGNC:20653
|
|
OMIM ID
|
608396 |
|
Summary
|
This gene encodes a sodium/proton exchanger that is a member of the solute carrier 9 protein family. The encoded protein localizes the to the late recycling endosomes and may play an important role in maintaining cation homeostasis. Mutations in this gene are associated with autism susceptibility 16 and attention-deficit/hyperactivity disorder. [provided by RefSeq, Mar 2012] |
Target gene [SLC9A9] related to VISs 
Integration Table: if previous studies reported that target gene was altered by virus integration events, the overlap between VISs in this literature and Cistrome factors was listed in this section
Target gene [SLC9A9] related to Omics data
| Data ID |
Experiment type |
Sample number |
Platform |
|
GSE189602
|
Methylation profiling (Array) |
4 |
Infinium MethylationEPIC |
|
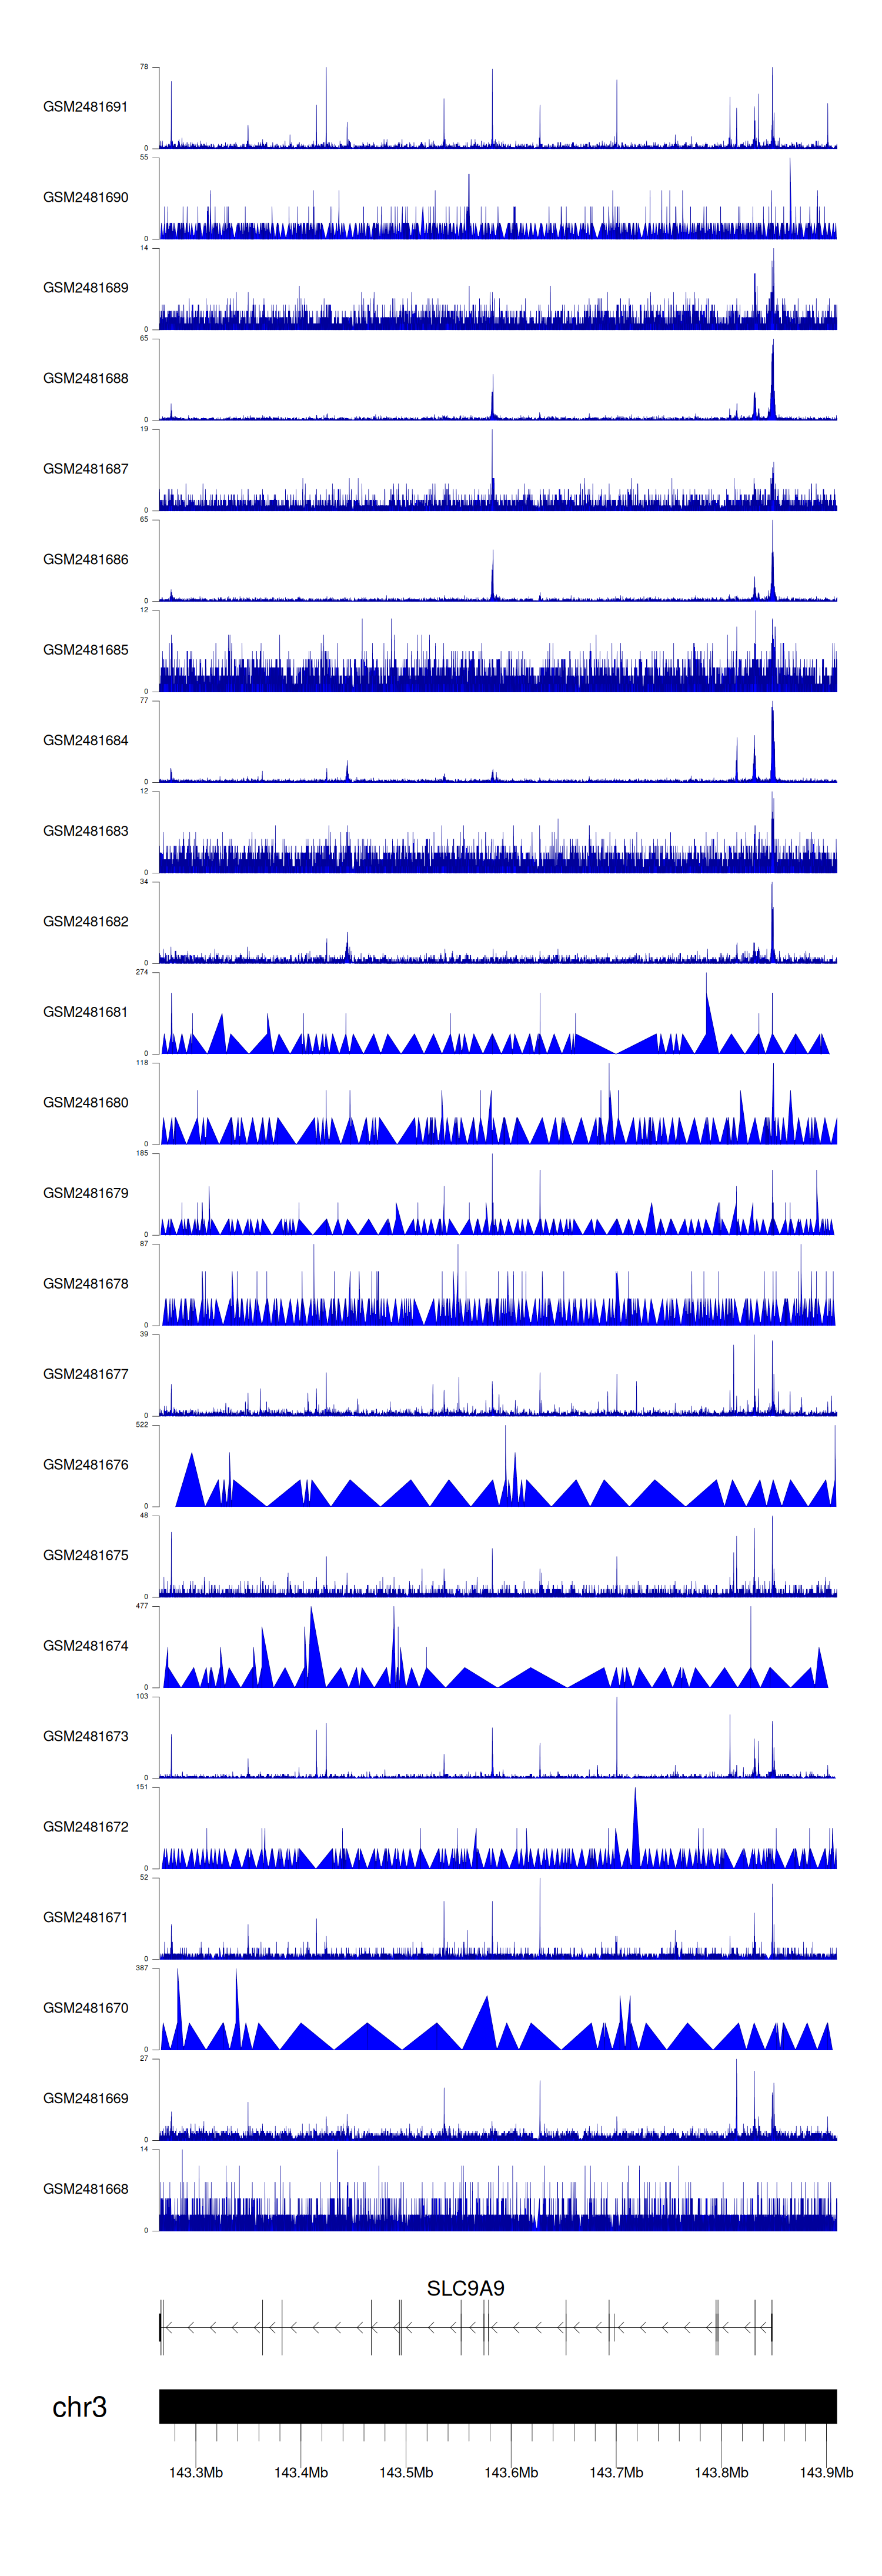
C GSE94732
|
Chip-seq |
24 |
Illumina NextSeq 500 (Homo sapiens);illumina Genome Analyzer IIx (Homo sapiens) |
|
GSE52244
|
Expression array |
15 |
[HuEx-1_0-st] Affymetrix Human Exon 1.0 ST Array [probe set (exon) version] |
|
GSE10789
|
Expression array |
6 |
NCI/ATC Hs-OperonV3 |
|
GSE224047
|
RNA-seq |
10 |
Illumina NextSeq 500 (Homo sapiens) |
|
GSE168557
|
Expression array |
6 |
Agilent-039494 SurePrint G3 Human GE v2 8x60K Microarray 039381 (Feature Number version) |
|
GSE136189
|
Methylation profiling (Array) |
40 |
Illumina HumanMethylation450 BeadChip (HumanMethylation450_15017482);Illumina Infinium HumanMethylation850 BeadChip |
When the gene can detect a peak in the dataset, a peak plot will be displayed.
> Dataset: GSE94732 - SLC9A9 peak across samples
|
Peak Plot
|
|
|
