Gene Information
|
Gene Name
|
SMAD1 |
|
Gene ID
|
4086
|
|
Gene Full Name
|
SMAD family member 1 |
|
Gene Alias
|
BSP-1|BSP1|JV4-1|JV41|MADH1|MADR1 |
|
Transcripts
|
ENSG00000170365
|
|
Virus
|
HBV |
|
Gene Type
|
protein-coding |
|
HPA Location Info
|
Nucleoplasm, Cytosol; 
|
|
Membrane Info
|
Cancer-related genes, Disease related genes, Predicted intracellular proteins, Transcription factors |
|
Uniport_ID
|
Q15797
|
|
HGNC ID
|
HGNC:6767
|
|
OMIM ID
|
601595 |
|
Summary
|
The protein encoded by this gene belongs to the SMAD, a family of proteins similar to the gene products of the Drosophila gene 'mothers against decapentaplegic' (Mad) and the C. elegans gene Sma. SMAD proteins are signal transducers and transcriptional modulators that mediate multiple signaling pathways. This protein mediates the signals of the bone morphogenetic proteins (BMPs), which are involved in a range of biological activities including cell growth, apoptosis, morphogenesis, development and immune responses. In response to BMP ligands, this protein can be phosphorylated and activated by the BMP receptor kinase. The phosphorylated form of this protein forms a complex with SMAD4, which is important for its function in the transcription regulation. This protein is a target for SMAD-specific E3 ubiquitin ligases, such as SMURF1 and SMURF2, and undergoes ubiquitination and proteasome-mediated degradation. Alternatively spliced transcript variants encoding the same protein have been observed. [provided by RefSeq, Jul 2008] |
Target gene [SMAD1] related to VISs 
Integration Table: if previous studies reported that target gene was altered by virus integration events, the overlap between VISs in this literature and Cistrome factors was listed in this section
| DVID |
Chromosome |
HM |
TFBS |
CA |
Sum of Overlapped Records |
Detail |
| 1010495 |
chr4 |
8 |
3 |
1 |
12 |
View |
Target gene [SMAD1] related to Omics data
| Data ID |
Experiment type |
Sample number |
Platform |
|
GSE236281
|
RNA-seq |
12 |
Illumina MiSeq (Homo sapiens) |
|
C GSE35465
|
Chip-seq;RNA-seq |
6 |
Illumina HiSeq 2000 (Homo sapiens) |
|
GSE199850
|
scRNA-seq |
1 |
HiSeq X Ten (Homo sapiens) |
|
C GSE68402
|
Chip-seq |
26 |
Illumina MiSeq (Homo sapiens);Illumina HiSeq 2500 (Homo sapiens) |
|
GSE247322
|
scRNA-seq |
27 |
Illumina NovaSeq 6000 (Homo sapiens) |
|
TCGA_LIHC_HBV
|
DNA methylation sequencing;RNA-seq |
97 |
TCGA |
|
C GSE270130
|
Chip-seq |
27 |
Illumina NovaSeq 6000 (Homo sapiens) |
|
GSE224901
|
RNA-seq |
21 |
Illumina NovaSeq 6000 (Homo sapiens) |
|
GSE100400
|
Chip-seq;RNA-seq;4C_cccDNA |
31 |
Illumina NextSeq 500 (Homo sapiens);Illumina NextSeq 500 (Mus musculus) |
|
GSE173897
|
RNA-seq |
95 |
Illumina HiSeq 4000 (Homo sapiens) |
|
GSE262515
|
RNA-seq |
21 |
Illumina HiSeq 2500 (Homo sapiens);Illumina HiSeq 2500 (Mus musculus) |
|
GSE110345
|
RNA-seq |
4 |
Illumina HiSeq 2500 (Homo sapiens) |
|
C GSE131257
|
ATAC-seq;RNA-seq |
19 |
Illumina HiSeq 2500 (Homo sapiens) |
|
GSE94660
|
RNA-seq |
42 |
Illumina HiSeq 2500 (Homo sapiens) |
When the gene can detect a peak in the dataset, a peak plot will be displayed.
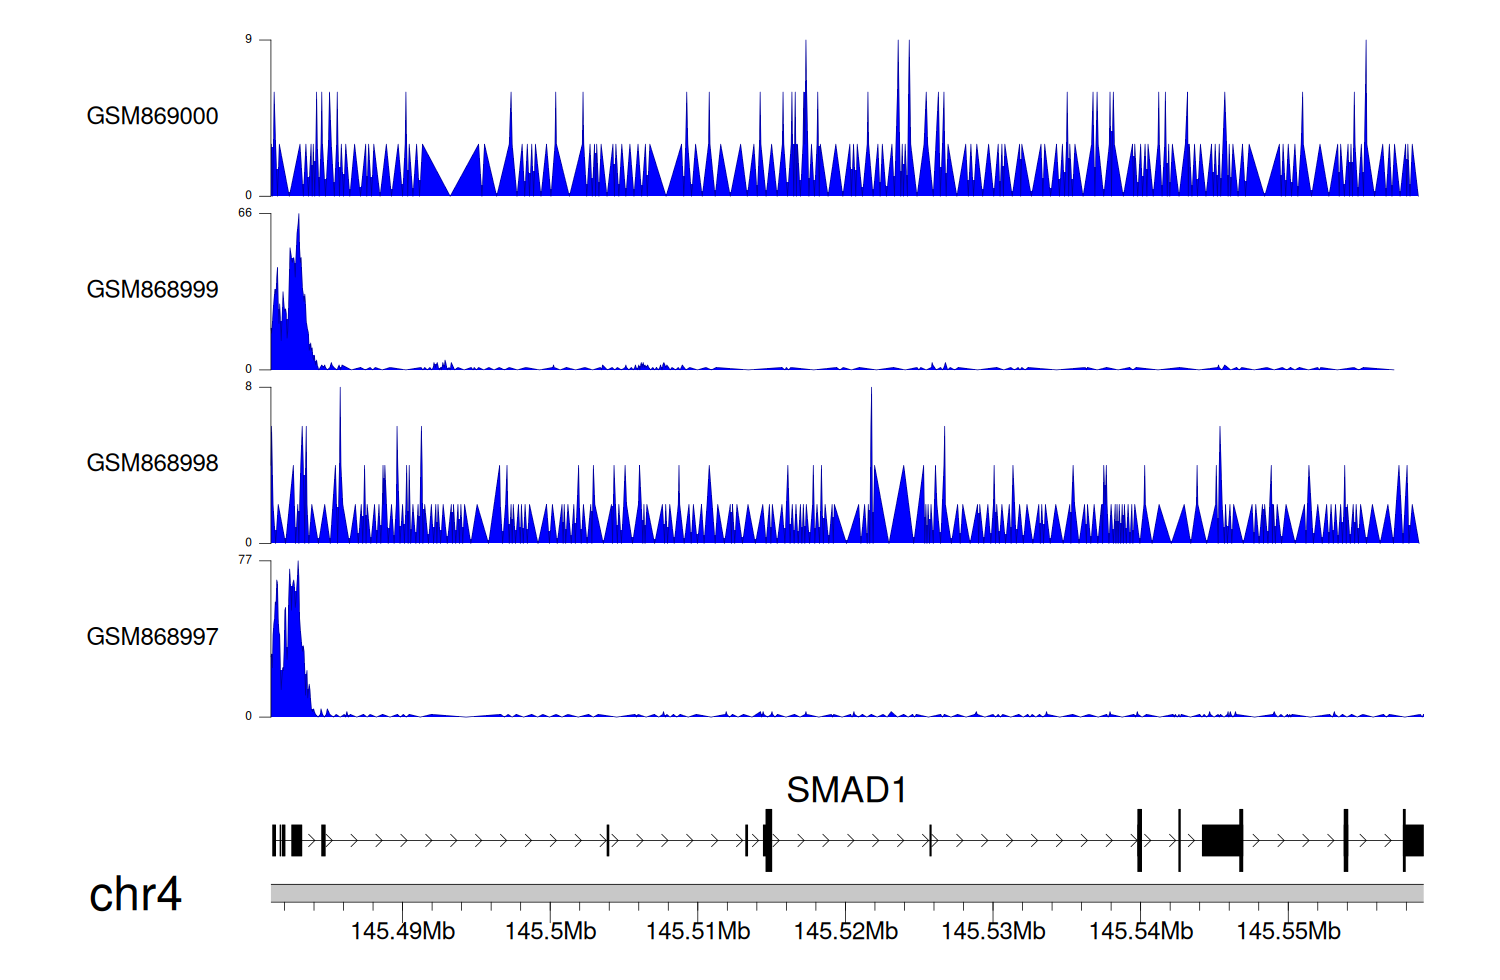
> Dataset: GSE35465 - SMAD1 peak across samples
|
Peak Plot
|
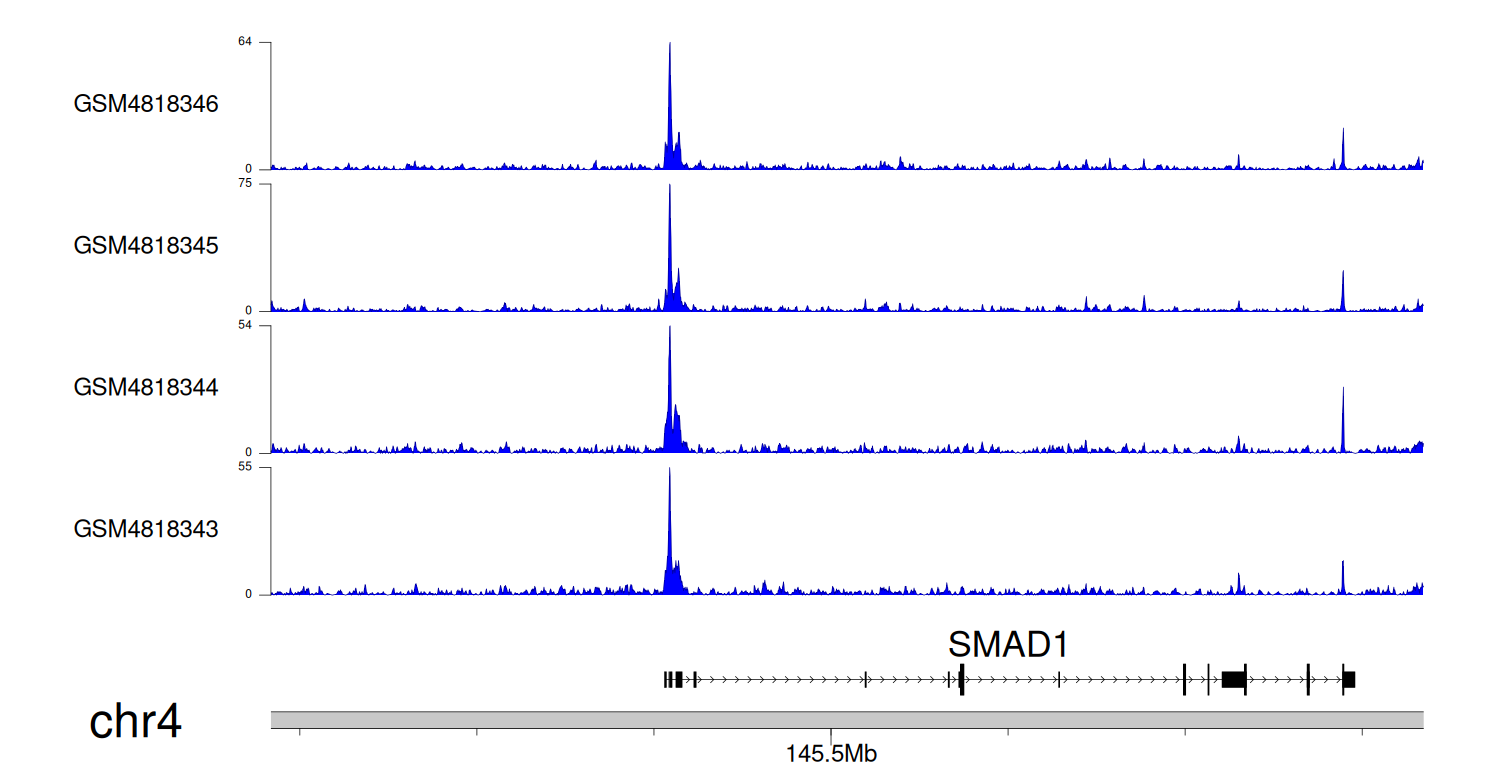
> Dataset: GSE68402 - SMAD1 peak across samples
|
Peak Plot
|
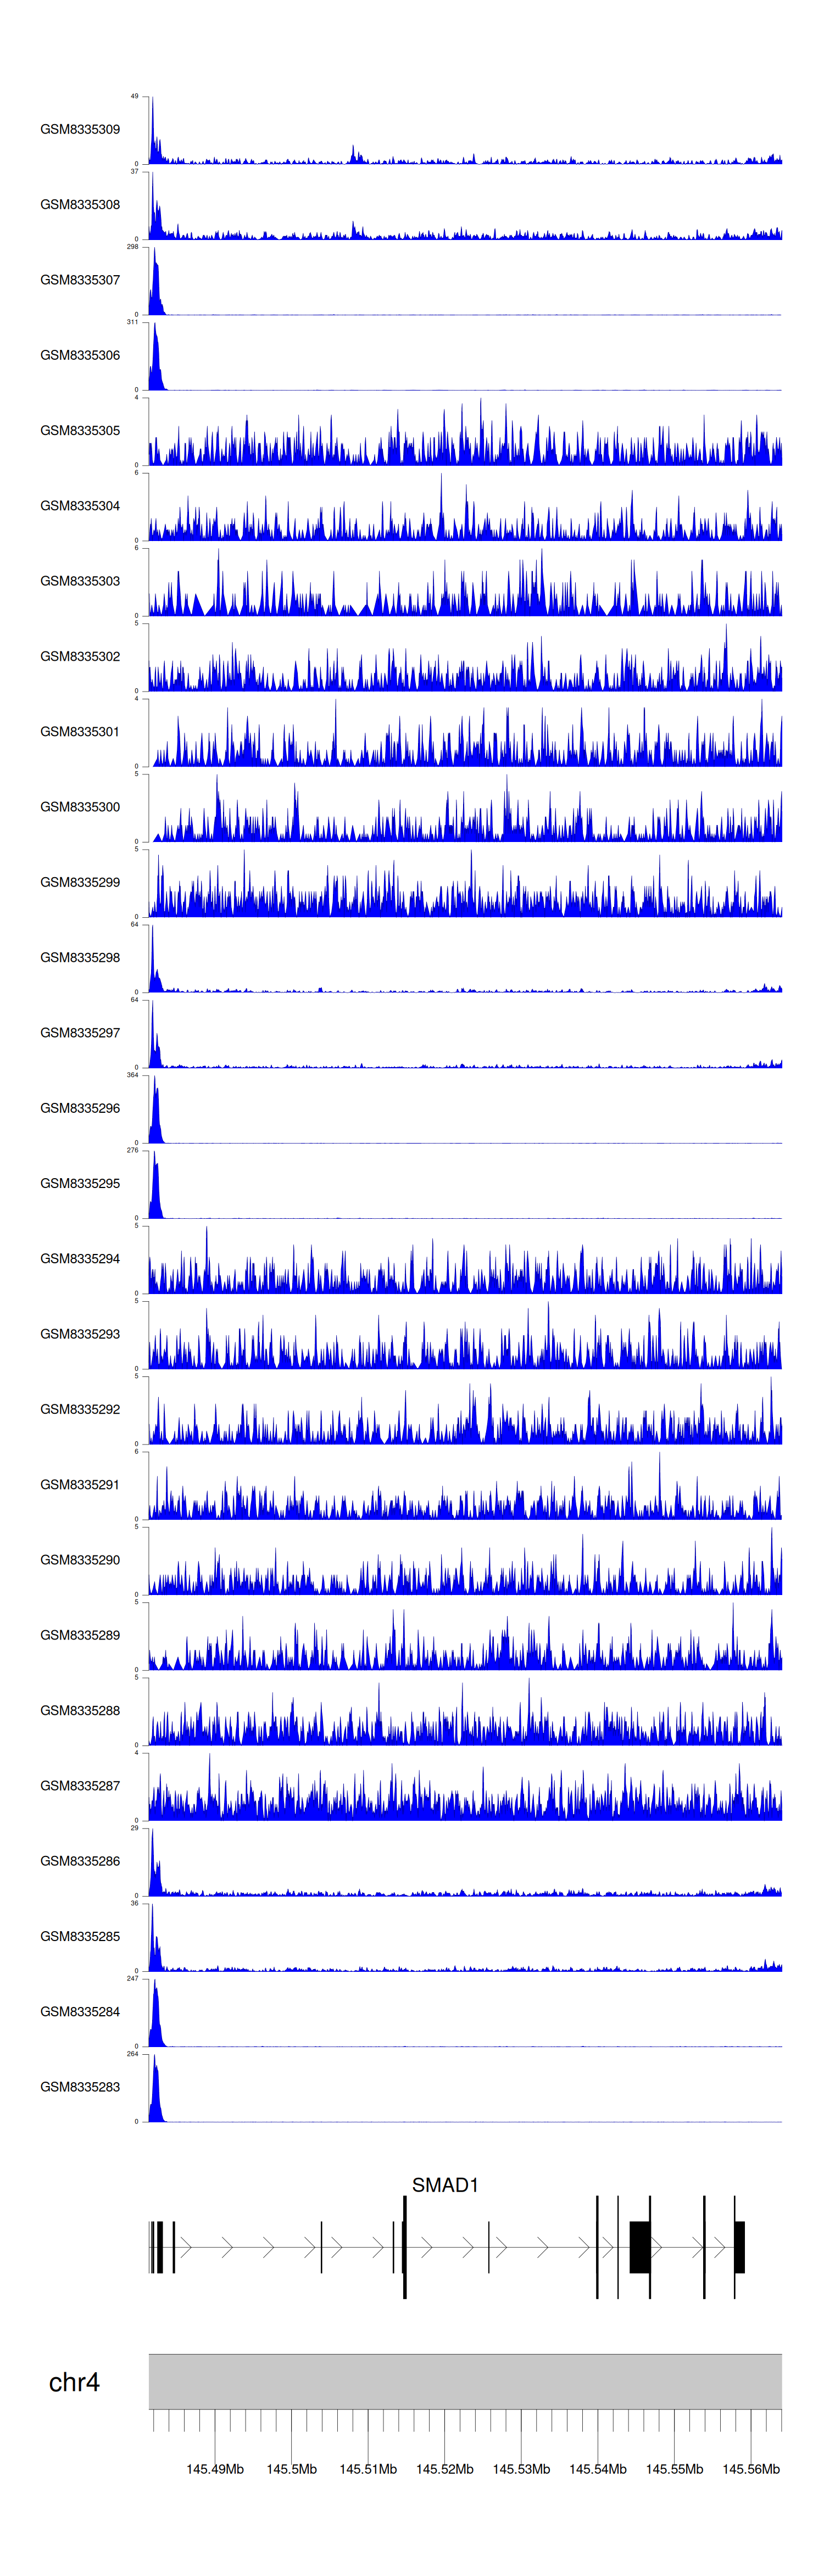
> Dataset: GSE270130 - SMAD1 peak across samples
|
Peak Plot
|
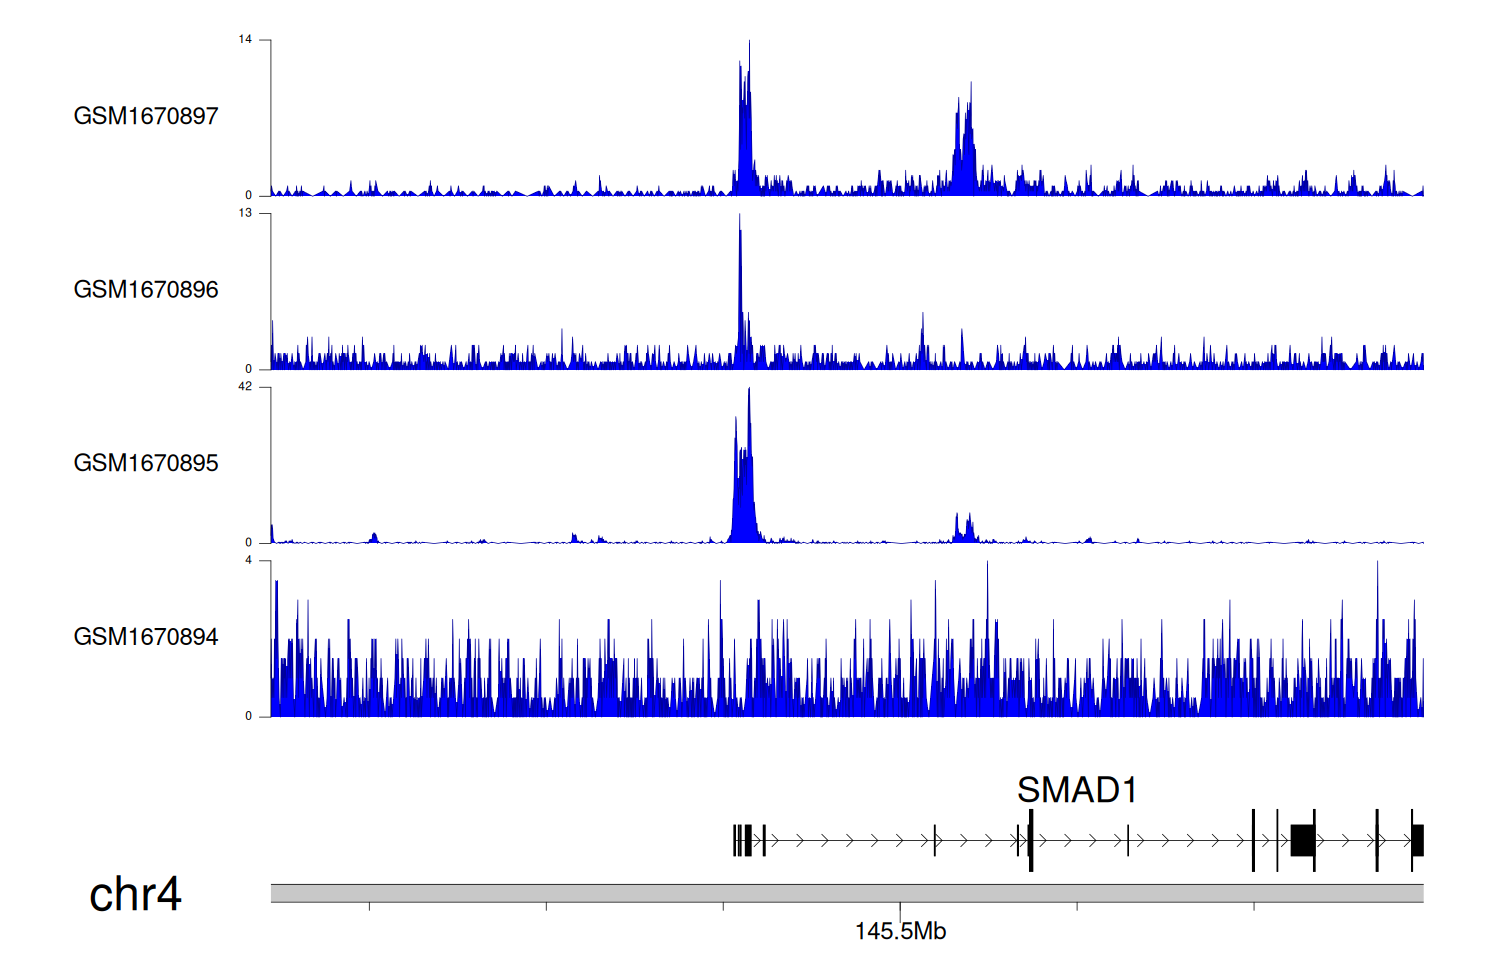
> Dataset: GSE131257 - SMAD1 peak across samples
|
Peak Plot
|
|
|
