Gene Information
|
Gene Name
|
SMAD3 |
|
Gene ID
|
4088
|
|
Gene Full Name
|
SMAD family member 3 |
|
Gene Alias
|
HSPC193|HsT17436|JV15-2|LDS1C|LDS3|MADH3|hMAD-3|hSMAD3|mad3 |
|
Transcripts
|
ENSG00000166949
|
|
Virus
|
HBV |
|
Gene Type
|
protein-coding |
|
HPA Location Info
|
Nucleoplasm;Vesicles, Primary cilium transition zone, Basal body; 
|
|
Membrane Info
|
Cancer-related genes, Disease related genes, Human disease related genes, Predicted intracellular proteins, Transcription factors |
|
Uniport_ID
|
P84022
|
|
HGNC ID
|
HGNC:6769
|
|
OMIM ID
|
603109 |
|
Summary
|
The SMAD family of proteins are a group of intracellular signal transducer proteins similar to the gene products of the Drosophila gene 'mothers against decapentaplegic' (Mad) and the C. elegans gene Sma. The SMAD3 protein functions in the transforming growth factor-beta signaling pathway, and transmits signals from the cell surface to the nucleus, regulating gene activity and cell proliferation. This protein forms a complex with other SMAD proteins and binds DNA, functioning both as a transcription factor and tumor suppressor. Mutations in this gene are associated with aneurysms-osteoarthritis syndrome and Loeys-Dietz Syndrome 3. [provided by RefSeq, May 2022] |
Target gene [SMAD3] related to virus gene/protein/region 
Mutation Table: if previous studies reported that target gene was related to virus gene/region/protein, the information in this literature was listed in this section
Target gene [SMAD3] related to VISs
Integration Table: if previous studies reported that target gene was altered by virus integration events, the overlap between VISs in this literature and Cistrome factors was listed in this section
| DVID |
Chromosome |
HM |
TFBS |
CA |
Sum of Overlapped Records |
Detail |
| 1019654 |
chr15 |
0 |
0 |
0 |
0 |
View |
Target gene [SMAD3] related to Omics data
| Data ID |
Experiment type |
Sample number |
Platform |
|
GSE236281
|
RNA-seq |
12 |
Illumina MiSeq (Homo sapiens) |
|
C GSE35465
|
Chip-seq;RNA-seq |
6 |
Illumina HiSeq 2000 (Homo sapiens) |
|
C GSE68402
|
Chip-seq |
26 |
Illumina MiSeq (Homo sapiens);Illumina HiSeq 2500 (Homo sapiens) |
|
S GSE247322
|
scRNA-seq |
27 |
Illumina NovaSeq 6000 (Homo sapiens) |
|
TCGA_LIHC_HBV
|
DNA methylation sequencing;RNA-seq |
97 |
TCGA |
|
C GSE270130
|
Chip-seq |
27 |
Illumina NovaSeq 6000 (Homo sapiens) |
|
GSE224901
|
RNA-seq |
21 |
Illumina NovaSeq 6000 (Homo sapiens) |
|
GSE100400
|
Chip-seq;RNA-seq;4C_cccDNA |
31 |
Illumina NextSeq 500 (Homo sapiens);Illumina NextSeq 500 (Mus musculus) |
|
GSE173897
|
RNA-seq |
95 |
Illumina HiSeq 4000 (Homo sapiens) |
|
GSE262515
|
RNA-seq |
21 |
Illumina HiSeq 2500 (Homo sapiens);Illumina HiSeq 2500 (Mus musculus) |
|
GSE110345
|
RNA-seq |
4 |
Illumina HiSeq 2500 (Homo sapiens) |
|
C GSE131257
|
ATAC-seq;RNA-seq |
19 |
Illumina HiSeq 2500 (Homo sapiens) |
|
E GSE94660
|
RNA-seq |
42 |
Illumina HiSeq 2500 (Homo sapiens) |
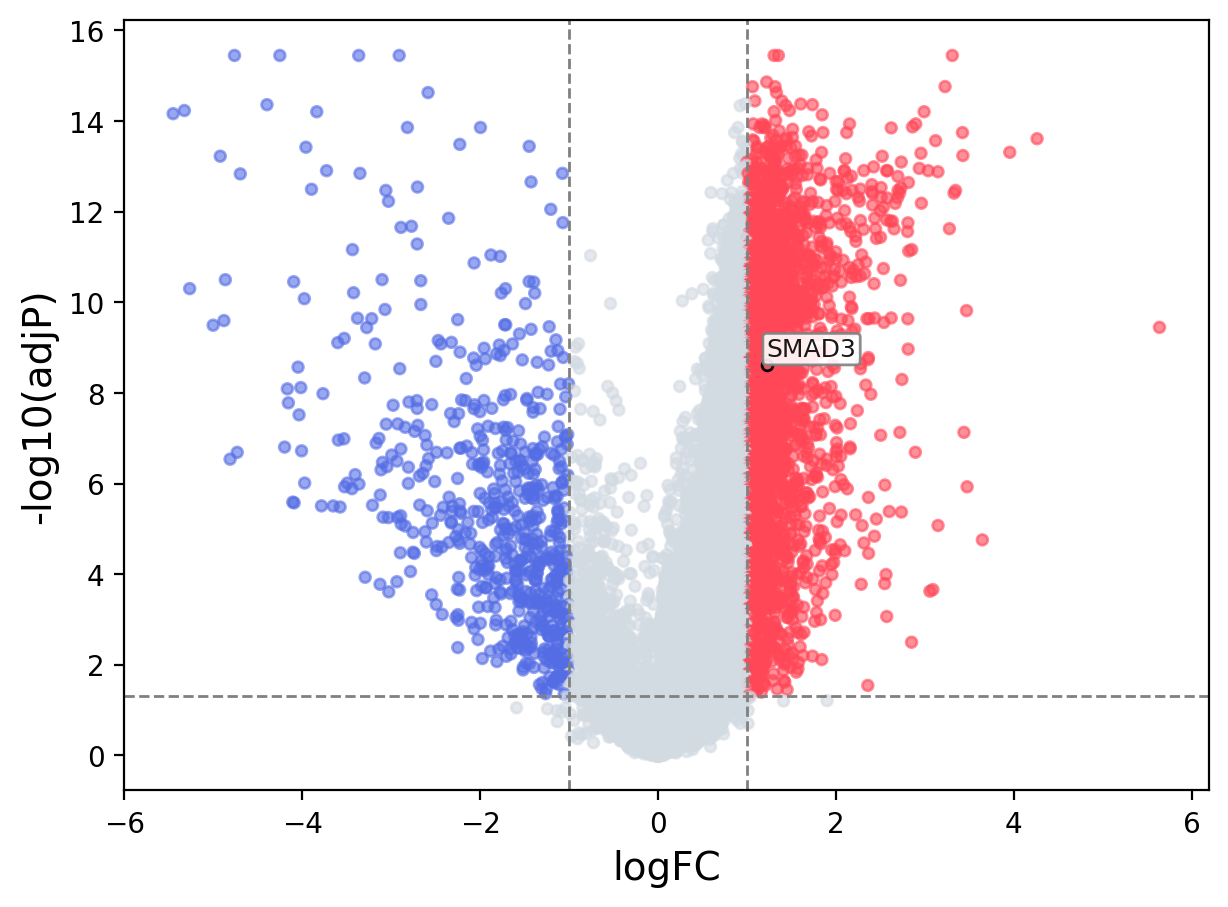
When the query gene is differentially changed in the dataset, a volcano/bar plot will be displayed.
> Dataset: GSE94660 - SMAD3 expression across samples
|
Volcano Plot
|
Bar Plot
|
|
|
