Gene Information
|
Gene Name
|
SORD |
|
Gene ID
|
6652
|
|
Gene Full Name
|
sorbitol dehydrogenase |
|
Gene Alias
|
HEL-S-95n|HMNR8|RDH|SDH|SORD1|SORDD|XDH |
|
Transcripts
|
ENSG00000140263
|
|
Virus
|
HTLV1 |
|
Gene Type
|
protein-coding |
|
HPA Location Info
|
Cytosol;Acrosome, Equatorial segment; 
|
|
Membrane Info
|
Disease related genes, Enzymes, Human disease related genes, Metabolic proteins, Plasma proteins, Potential drug targets, Predicted intracellular proteins |
|
Uniport_ID
|
Q00796
|
|
HGNC ID
|
HGNC:11184
|
|
OMIM ID
|
182500 |
|
Summary
|
Sorbitol dehydrogenase (SORD; EC 1.1.1.14) catalyzes the interconversion of polyols and their corresponding ketoses, and together with aldose reductase (ALDR1; MIM 103880), makes up the sorbitol pathway that is believed to play an important role in the development of diabetic complications (summarized by Carr and Markham, 1995 [PubMed 8535074]). The first reaction of the pathway (also called the polyol pathway) is the reduction of glucose to sorbitol by ALDR1 with NADPH as the cofactor. SORD then oxidizes the sorbitol to fructose using NAD(+) cofactor.[supplied by OMIM, Jul 2010] |
Target gene [SORD] related to VISs 
Integration Table: if previous studies reported that target gene was altered by virus integration events, the overlap between VISs in this literature and Cistrome factors was listed in this section
| DVID |
Chromosome |
HM |
TFBS |
CA |
Sum of Overlapped Records |
Detail |
| 6002298 |
chr15 |
236 |
5 |
17 |
258 |
View |
Target gene [SORD] related to Omics data
| Data ID |
Experiment type |
Sample number |
Platform |
|
GSE189602
|
Methylation profiling (Array) |
4 |
Infinium MethylationEPIC |
|
C GSE94732
|
Chip-seq |
24 |
Illumina NextSeq 500 (Homo sapiens);illumina Genome Analyzer IIx (Homo sapiens) |
|
GSE52244
|
Expression array |
15 |
[HuEx-1_0-st] Affymetrix Human Exon 1.0 ST Array [probe set (exon) version] |
|
GSE10789
|
Expression array |
6 |
NCI/ATC Hs-OperonV3 |
|
GSE224047
|
RNA-seq |
10 |
Illumina NextSeq 500 (Homo sapiens) |
|
GSE168557
|
Expression array |
6 |
Agilent-039494 SurePrint G3 Human GE v2 8x60K Microarray 039381 (Feature Number version) |
|
GSE136189
|
Methylation profiling (Array) |
40 |
Illumina HumanMethylation450 BeadChip (HumanMethylation450_15017482);Illumina Infinium HumanMethylation850 BeadChip |
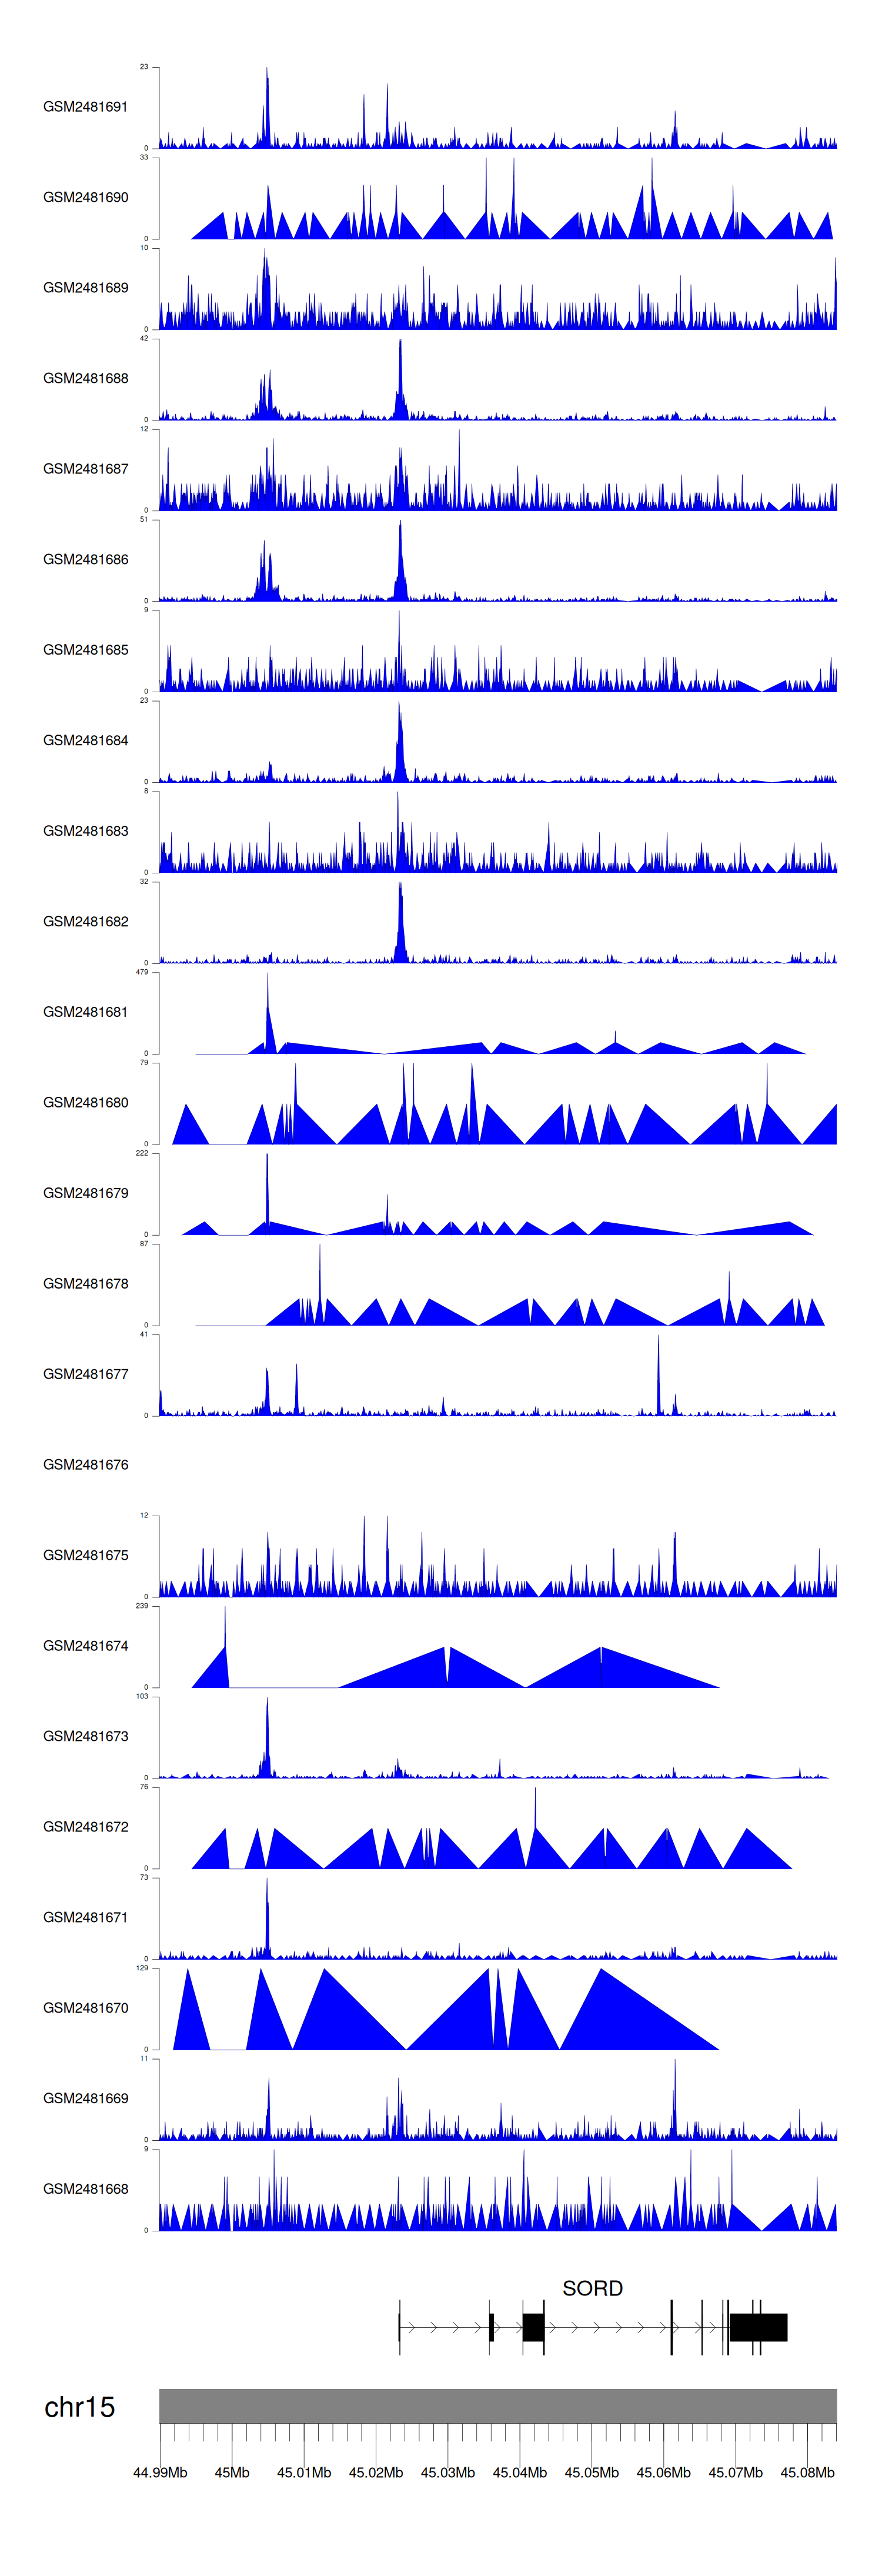
When the gene can detect a peak in the dataset, a peak plot will be displayed.
> Dataset: GSE94732 - SORD peak across samples
|
Peak Plot
|
|
|
