Gene Information
|
Gene Name
|
SPEN |
|
Gene ID
|
23013
|
|
Gene Full Name
|
spen family transcriptional repressor |
|
Gene Alias
|
HIAA0929|MINT|RATARS|RBM15C|SHARP |
|
Transcripts
|
ENSG00000065526
|
|
Virus
|
HBV |
|
Gene Type
|
protein-coding |
|
HPA Location Info
|
Nucleoplasm; 
|
|
Membrane Info
|
Cancer-related genes, Disease related genes, Human disease related genes, Plasma proteins, Predicted intracellular proteins |
|
Uniport_ID
|
Q96T58
|
|
HGNC ID
|
HGNC:17575
|
|
OMIM ID
|
613484 |
|
Summary
|
This gene encodes a hormone inducible transcriptional repressor. Repression of transcription by this gene product can occur through interactions with other repressors, by the recruitment of proteins involved in histone deacetylation, or through sequestration of transcriptional activators. The product of this gene contains a carboxy-terminal domain that permits binding to other corepressor proteins. This domain also permits interaction with members of the NuRD complex, a nucleosome remodeling protein complex that contains deacetylase activity. In addition, this repressor contains several RNA recognition motifs that confer binding to a steroid receptor RNA coactivator; this binding can modulate the activity of both liganded and nonliganded steroid receptors. [provided by RefSeq, Jul 2008] |
Target gene [SPEN] related to VISs 
Integration Table: if previous studies reported that target gene was altered by virus integration events, the overlap between VISs in this literature and Cistrome factors was listed in this section
| DVID |
Chromosome |
HM |
TFBS |
CA |
Sum of Overlapped Records |
Detail |
| 1007707 |
chr1 |
25 |
0 |
0 |
25 |
View |
Target gene [SPEN] related to Omics data
| Data ID |
Experiment type |
Sample number |
Platform |
|
GSE236281
|
RNA-seq |
12 |
Illumina MiSeq (Homo sapiens) |
|
C GSE35465
|
Chip-seq;RNA-seq |
6 |
Illumina HiSeq 2000 (Homo sapiens) |
|
C GSE68402
|
Chip-seq |
26 |
Illumina MiSeq (Homo sapiens);Illumina HiSeq 2500 (Homo sapiens) |
|
GSE247322
|
scRNA-seq |
27 |
Illumina NovaSeq 6000 (Homo sapiens) |
|
TCGA_LIHC_HBV
|
DNA methylation sequencing;RNA-seq |
97 |
TCGA |
|
C GSE270130
|
Chip-seq |
27 |
Illumina NovaSeq 6000 (Homo sapiens) |
|
GSE224901
|
RNA-seq |
21 |
Illumina NovaSeq 6000 (Homo sapiens) |
|
GSE100400
|
Chip-seq;RNA-seq;4C_cccDNA |
31 |
Illumina NextSeq 500 (Homo sapiens);Illumina NextSeq 500 (Mus musculus) |
|
GSE173897
|
RNA-seq |
95 |
Illumina HiSeq 4000 (Homo sapiens) |
|
GSE262515
|
RNA-seq |
21 |
Illumina HiSeq 2500 (Homo sapiens);Illumina HiSeq 2500 (Mus musculus) |
|
GSE110345
|
RNA-seq |
4 |
Illumina HiSeq 2500 (Homo sapiens) |
|
C GSE131257
|
ATAC-seq;RNA-seq |
19 |
Illumina HiSeq 2500 (Homo sapiens) |
|
GSE94660
|
RNA-seq |
42 |
Illumina HiSeq 2500 (Homo sapiens) |
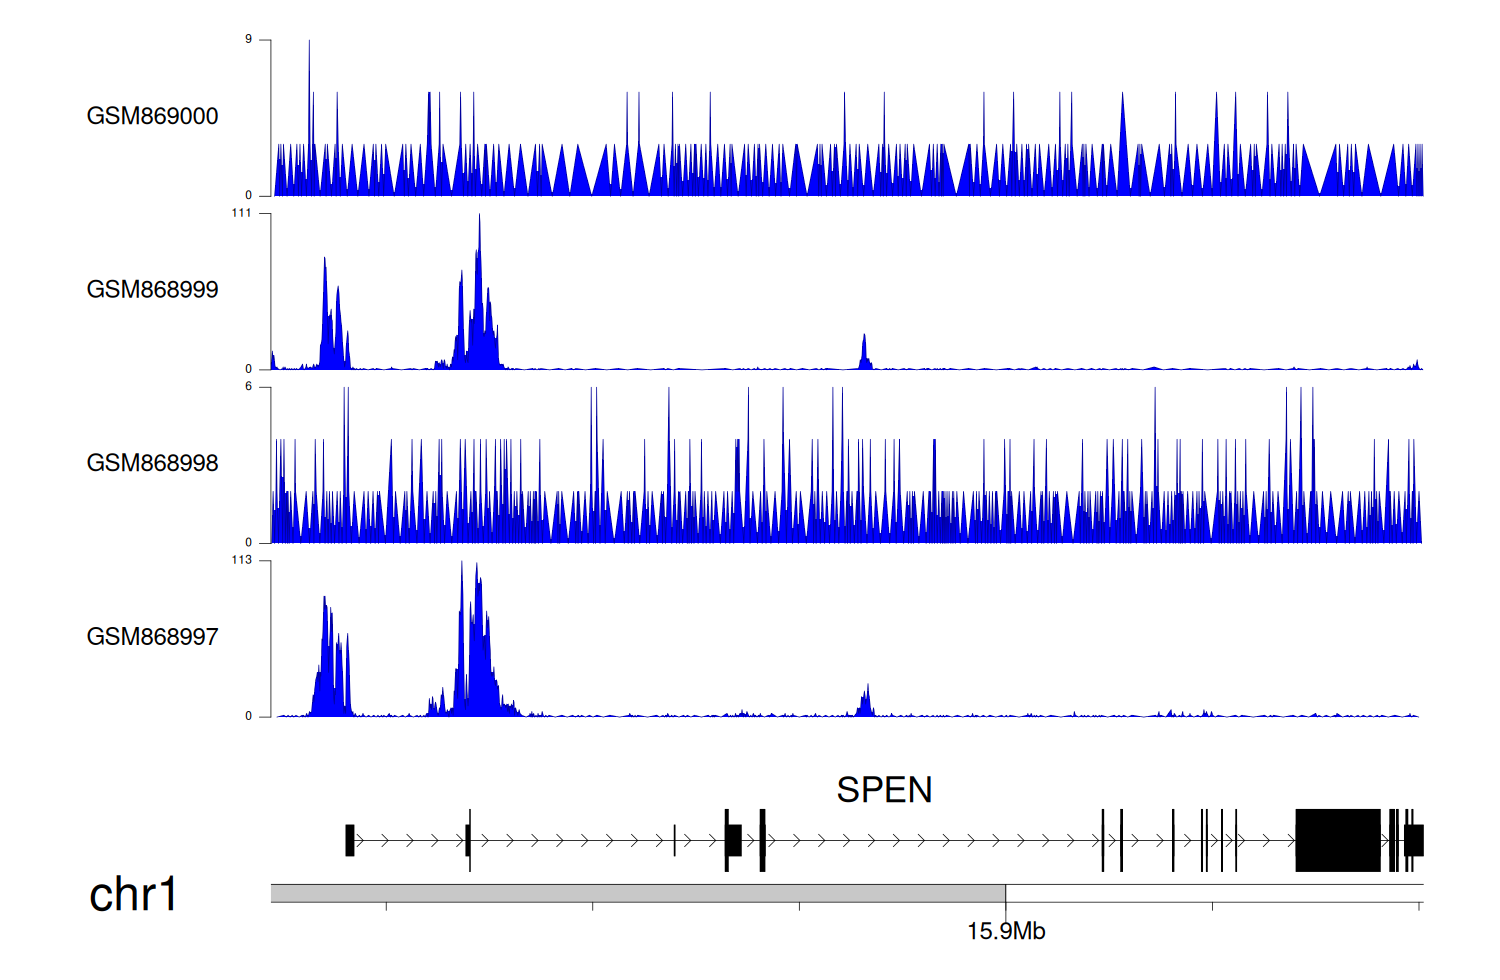
When the gene can detect a peak in the dataset, a peak plot will be displayed.
> Dataset: GSE35465 - SPEN peak across samples
|
Peak Plot
|
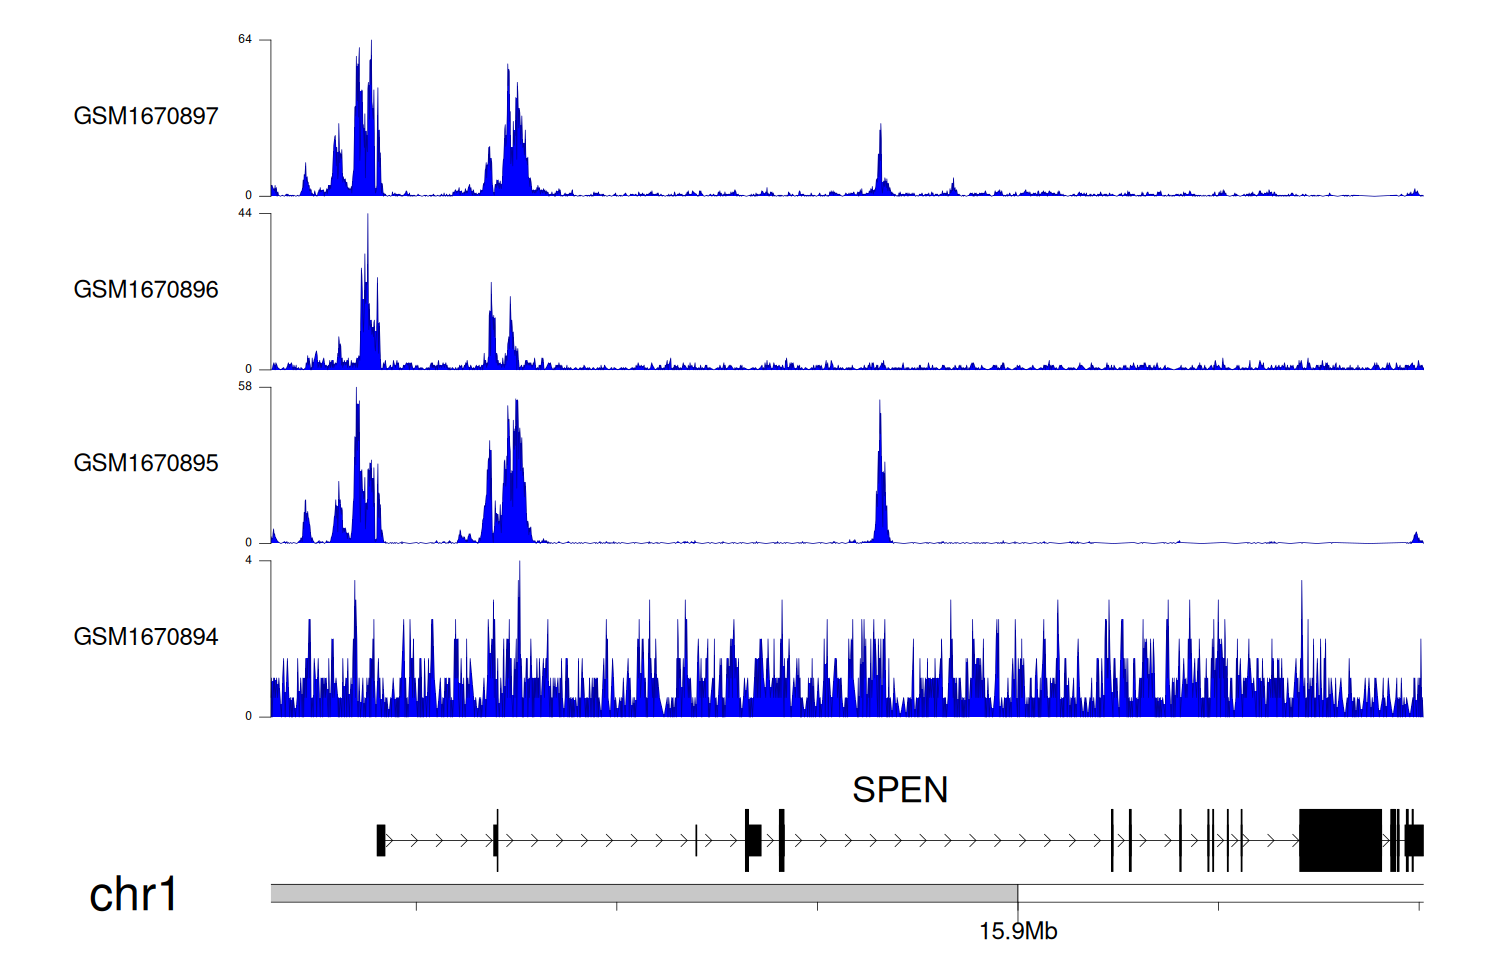
> Dataset: GSE68402 - SPEN peak across samples
|
Peak Plot
|
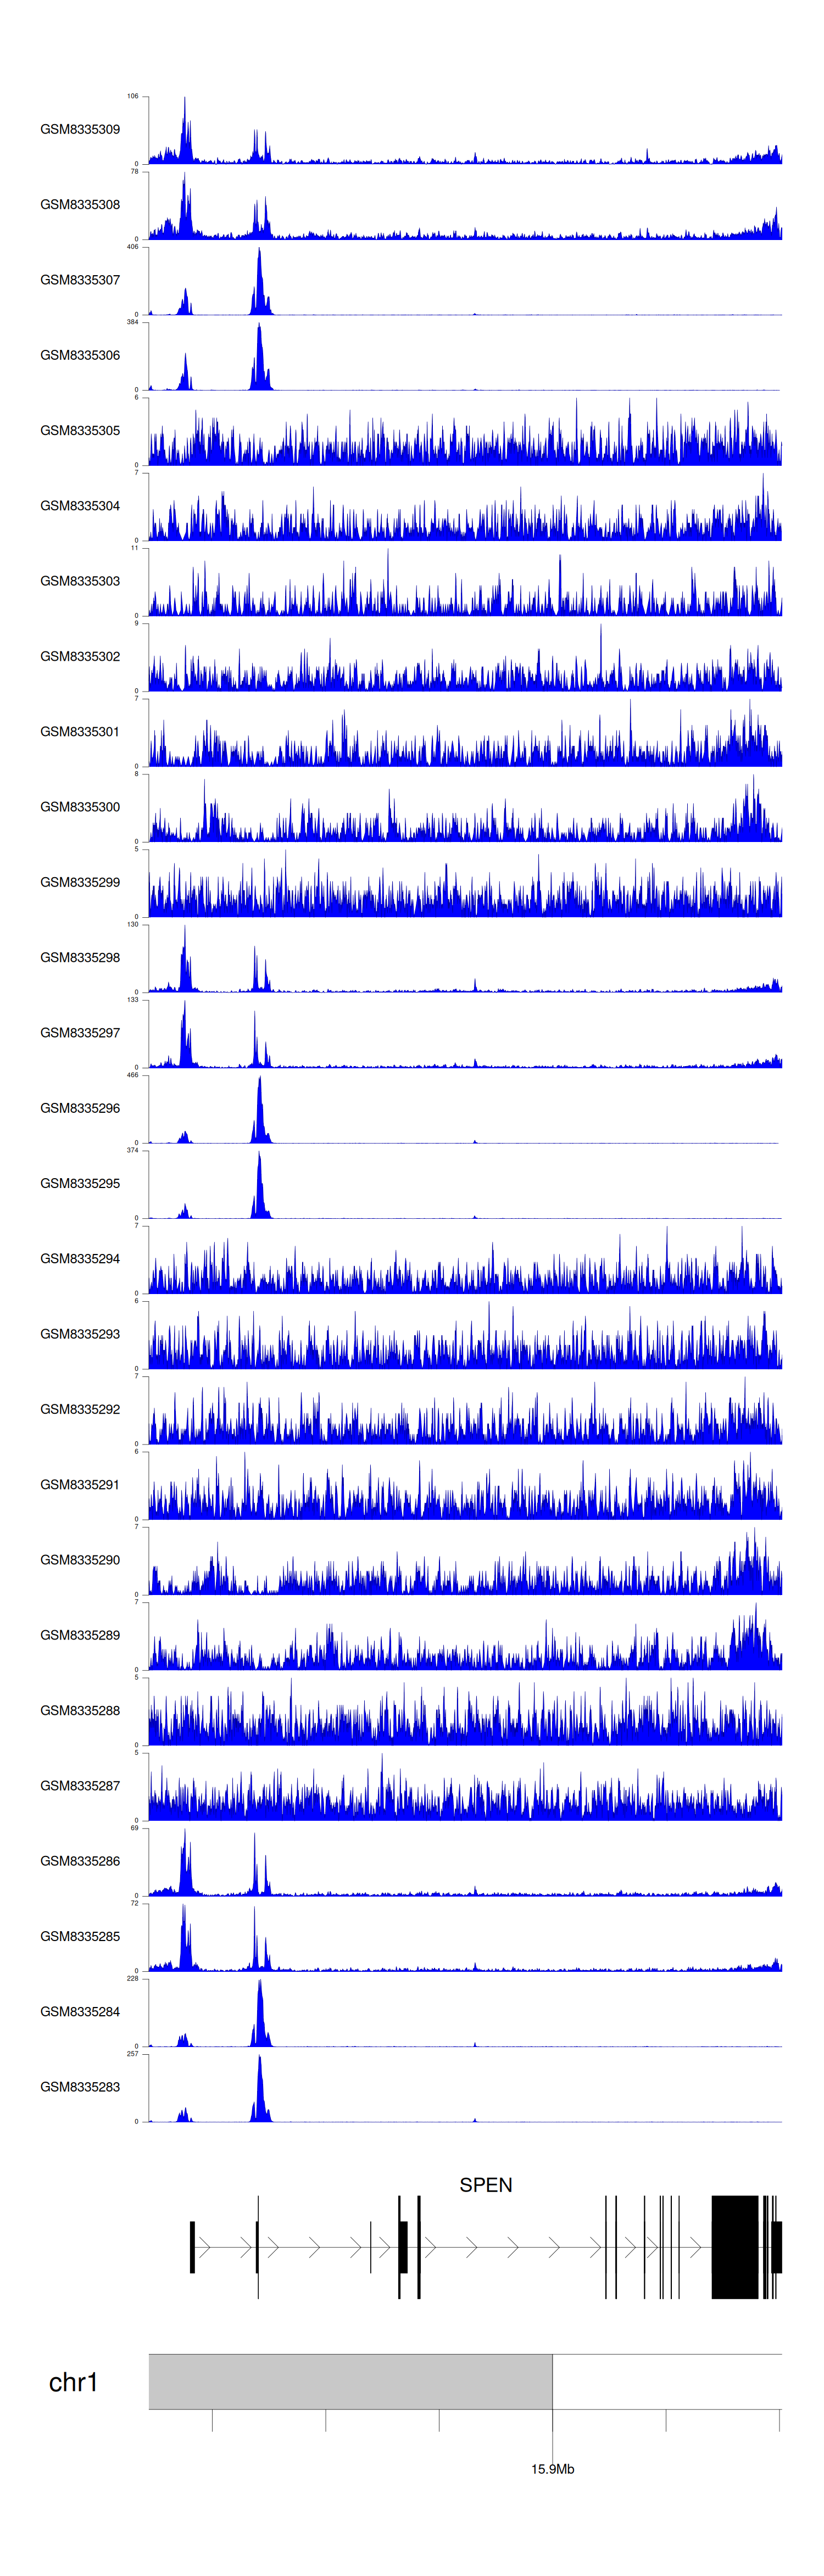
> Dataset: GSE270130 - SPEN peak across samples
|
Peak Plot
|
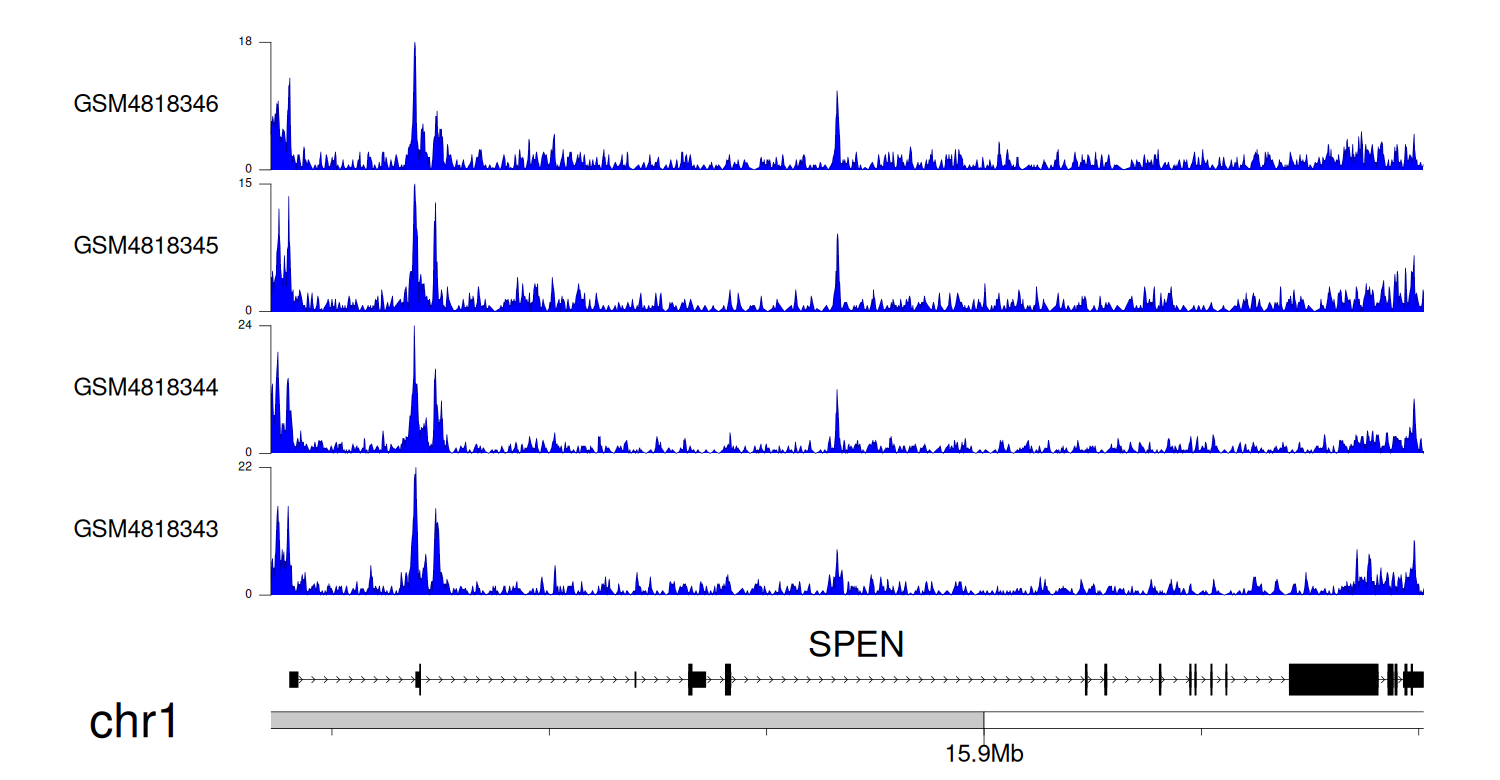
> Dataset: GSE131257 - SPEN peak across samples
|
Peak Plot
|
|
|
