Gene Information
|
Gene Name
|
STARD13 |
|
Gene ID
|
90627
|
|
Gene Full Name
|
StAR related lipid transfer domain containing 13 |
|
Gene Alias
|
ARHGAP37|DLC2|GT650|LINC00464 |
|
Transcripts
|
ENSG00000133121
|
|
Virus
|
HTLV1 |
|
Gene Type
|
protein-coding |
|
HPA Location Info
|
Golgi apparatus, Vesicles;Nucleoplasm; 
|
|
Membrane Info
|
Metabolic proteins, Plasma proteins, Predicted intracellular proteins |
|
Uniport_ID
|
Q9Y3M8
|
|
HGNC ID
|
HGNC:19164
|
|
OMIM ID
|
609866 |
|
Summary
|
This gene encodes a protein which contains an N-terminal sterile alpha motif (SAM) for protein-protein interactions, followed by an ATP/GTP-binding motif, a GTPase-activating protein (GAP) domain, and a C-terminal STAR-related lipid transfer (START) domain. It may be involved in regulation of cytoskeletal reorganization, cell proliferation, and cell motility, and acts as a tumor suppressor in hepatoma cells. The gene is located in a region of chromosome 13 that is associated with loss of heterozygosity in hepatocellular carcinomas. Alternatively spliced transcript variants encoding different isoforms have been described for this gene. [provided by RefSeq, Aug 2011] |
Target gene [STARD13] related to VISs 
Integration Table: if previous studies reported that target gene was altered by virus integration events, the overlap between VISs in this literature and Cistrome factors was listed in this section
Target gene [STARD13] related to Omics data
| Data ID |
Experiment type |
Sample number |
Platform |
|
C GSE94732
|
Chip-seq |
24 |
Illumina NextSeq 500 (Homo sapiens);illumina Genome Analyzer IIx (Homo sapiens) |
|
GSE168557
|
Expression array |
6 |
Agilent-039494 SurePrint G3 Human GE v2 8x60K Microarray 039381 (Feature Number version) |
|
GSE52244
|
Expression array |
15 |
[HuEx-1_0-st] Affymetrix Human Exon 1.0 ST Array [probe set (exon) version] |
|
GSE10789
|
Expression array |
6 |
NCI/ATC Hs-OperonV3 |
|
GSE189602
|
Methylation profiling (Array) |
4 |
Infinium MethylationEPIC |
|
GSE136189
|
Methylation profiling (Array) |
40 |
Illumina HumanMethylation450 BeadChip (HumanMethylation450_15017482);Illumina Infinium HumanMethylation850 BeadChip |
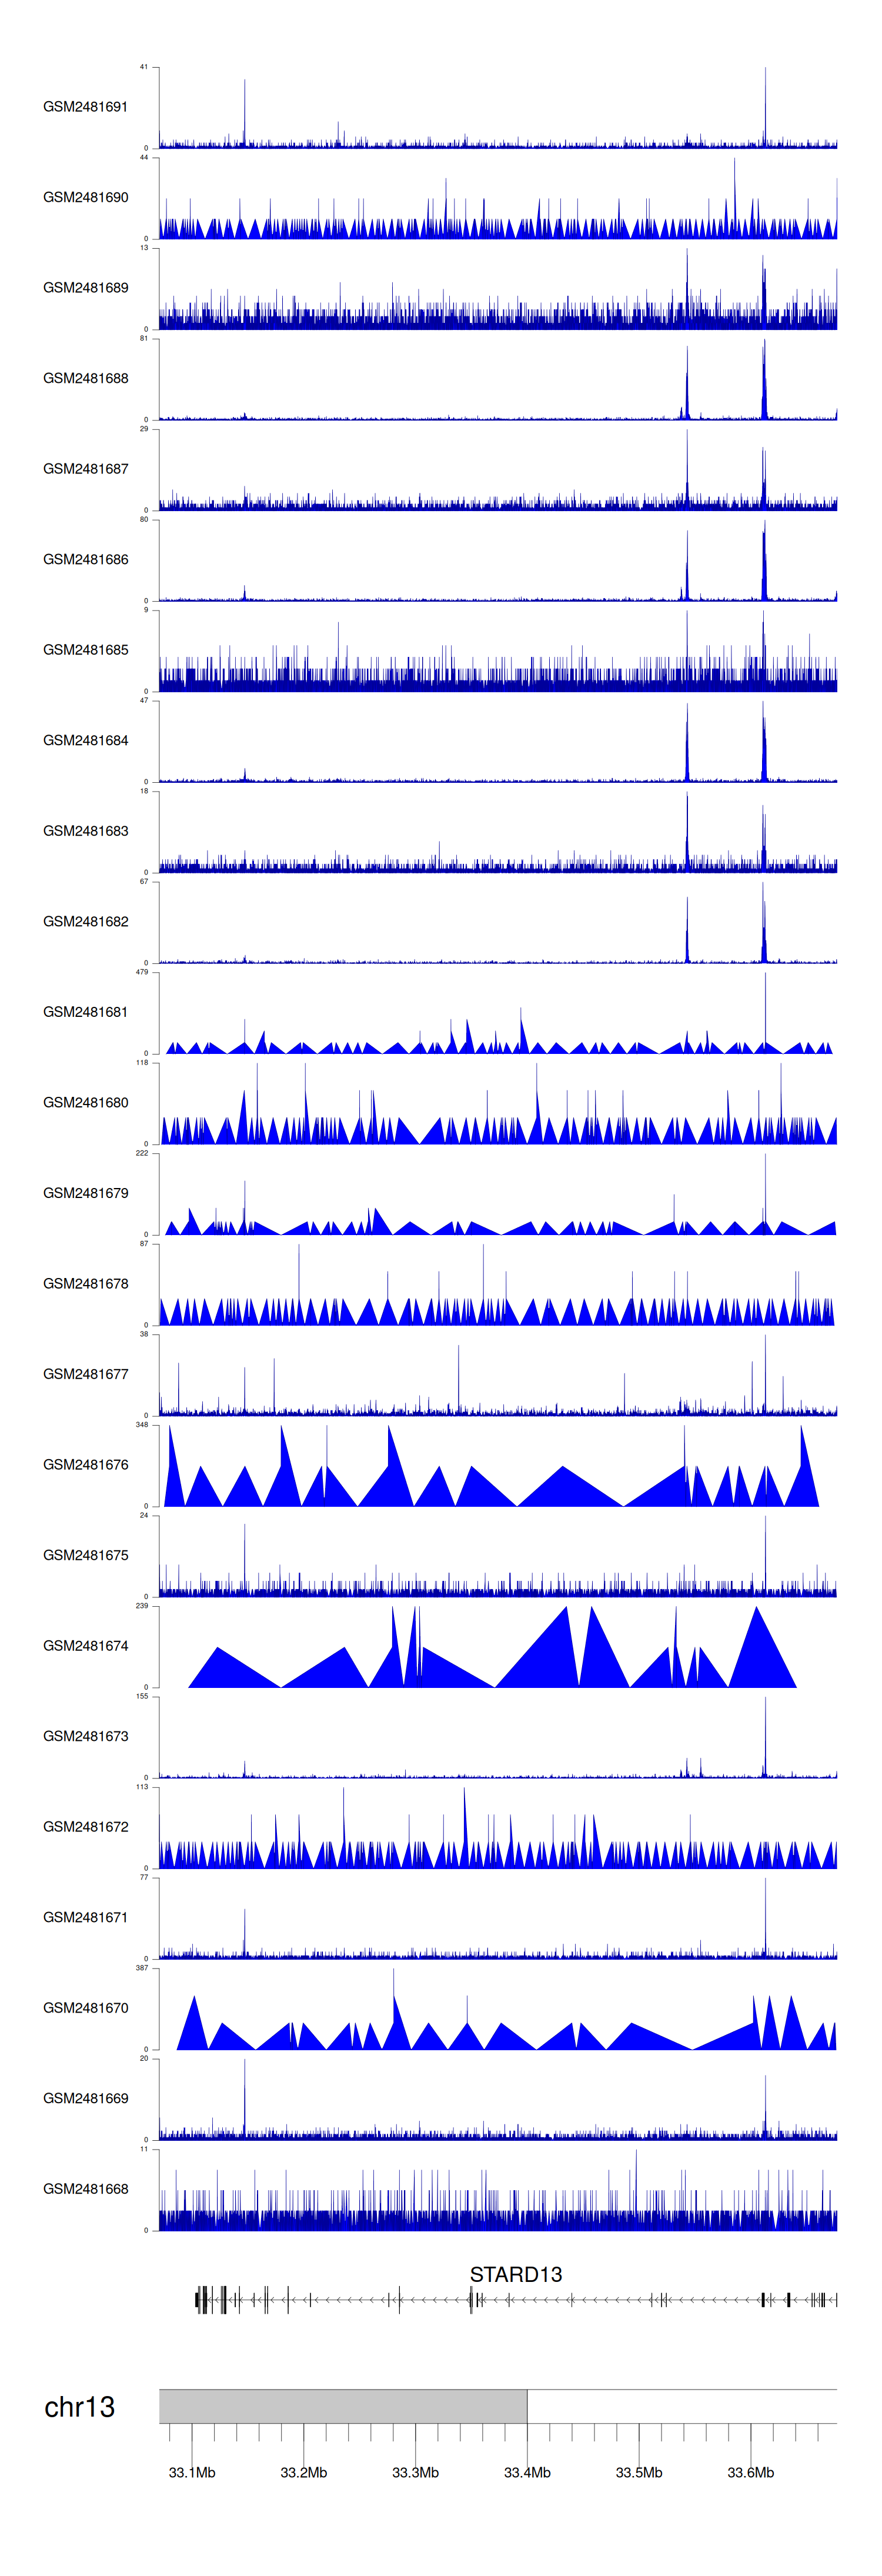
When the gene can detect a peak in the dataset, a peak plot will be displayed.
> Dataset: GSE94732 - STARD13 peak across samples
|
Peak Plot
|
|
|
