Gene Information
|
Gene Name
|
STIM2 |
|
Gene ID
|
57620
|
|
Gene Full Name
|
stromal interaction molecule 2 |
|
Gene Alias
|
- |
|
Transcripts
|
ENSG00000109689
|
|
Virus
|
HTLV1 |
|
Gene Type
|
protein-coding |
|
HPA Location Info
|

|
|
Membrane Info
|
Plasma proteins, Predicted intracellular proteins, Predicted membrane proteins, Transporters |
|
Uniport_ID
|
Q9P246
|
|
HGNC ID
|
HGNC:19205
|
|
OMIM ID
|
610841 |
|
Summary
|
This gene is a member of the stromal interaction molecule (STIM) family and likely arose, along with related family member STIM1, from a common ancestral gene. The encoded protein functions to regulate calcium concentrations in the cytosol and endoplasmic reticulum, and is involved in the activation of plasma membrane Orai Ca(2+) entry channels. This gene initiates translation from a non-AUG (UUG) start site. A signal peptide is cleaved from the resulting protein. Multiple transcript variants result from alternative splicing. [provided by RefSeq, Dec 2009] |
Target gene [STIM2] related to VISs 
Integration Table: if previous studies reported that target gene was altered by virus integration events, the overlap between VISs in this literature and Cistrome factors was listed in this section
Target gene [STIM2] related to Omics data
| Data ID |
Experiment type |
Sample number |
Platform |
|
GSE189602
|
Methylation profiling (Array) |
4 |
Infinium MethylationEPIC |
|
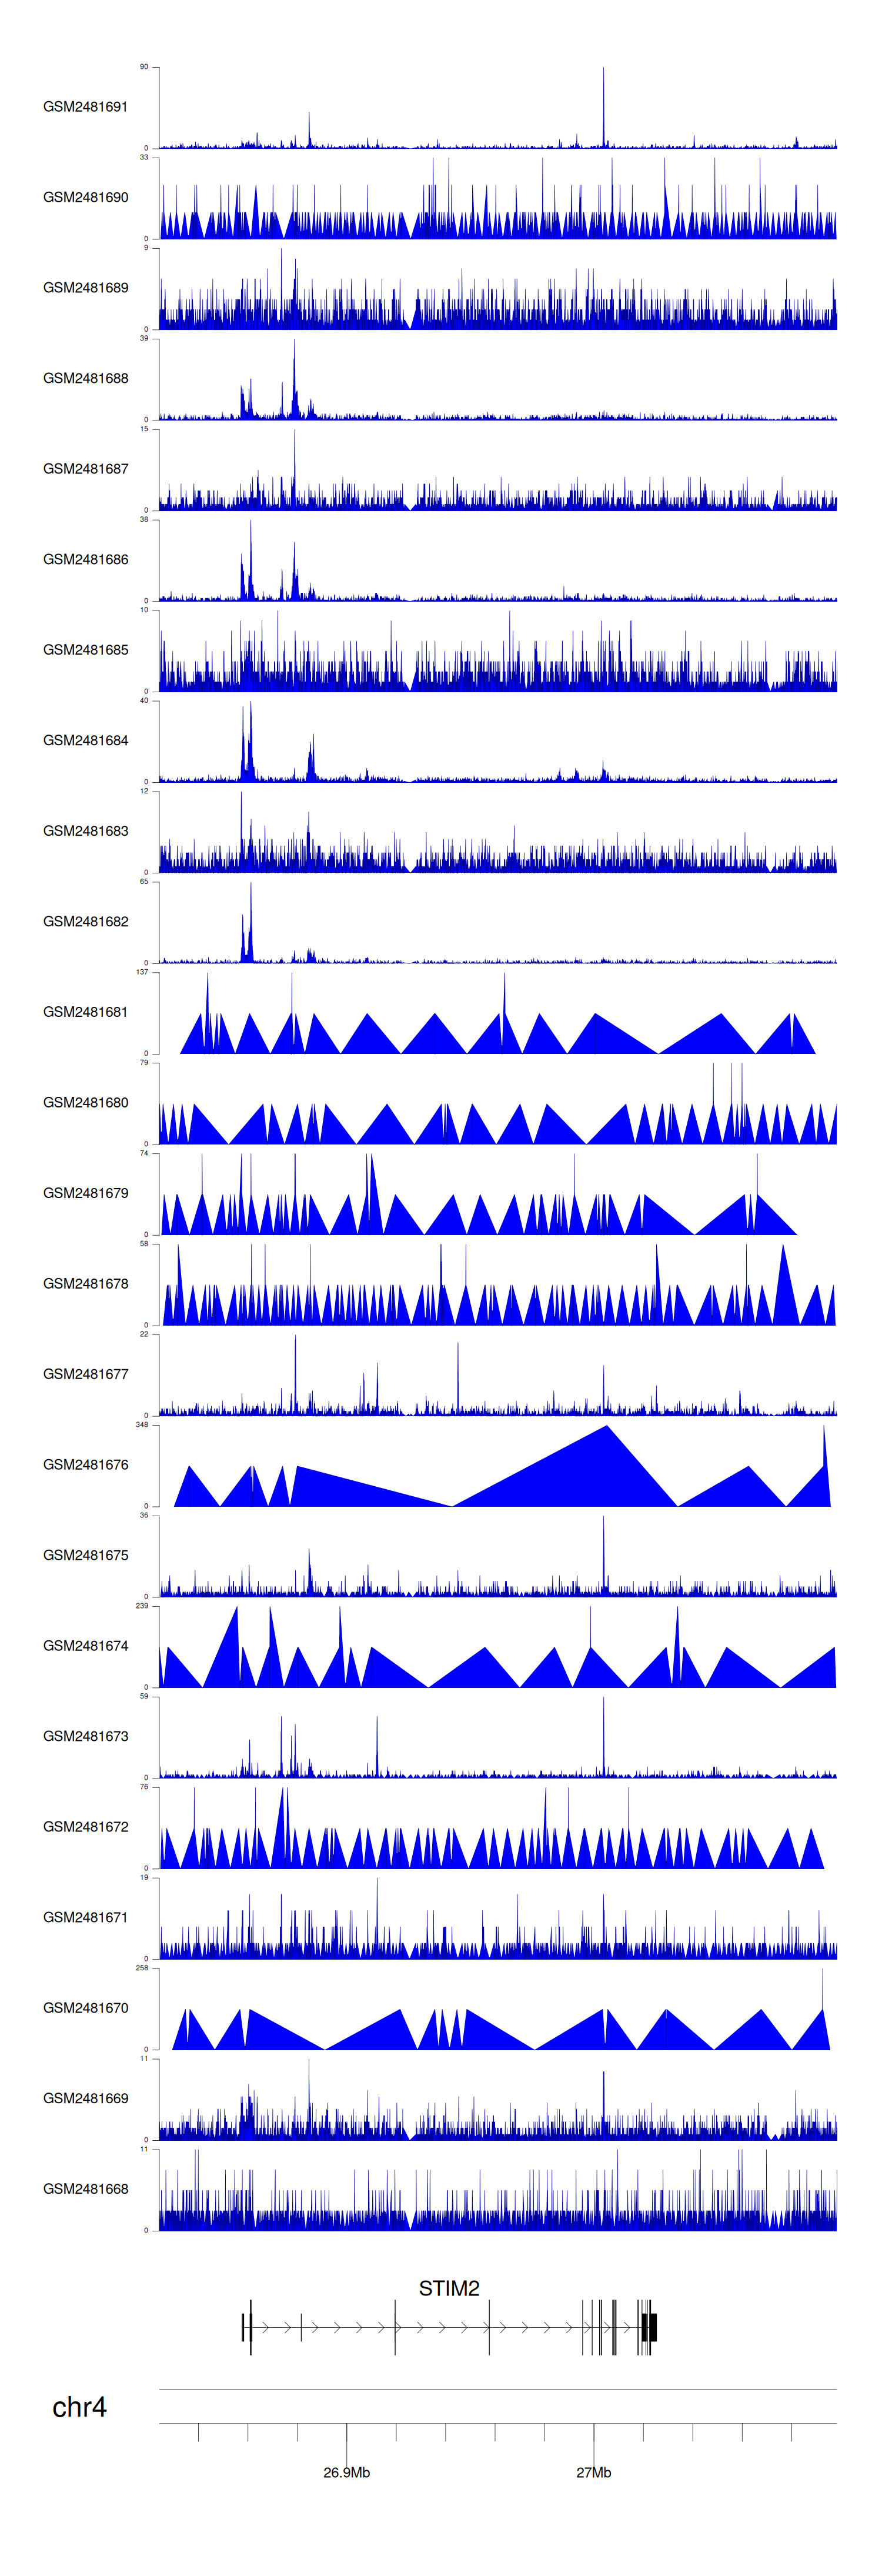
C GSE94732
|
Chip-seq |
24 |
Illumina NextSeq 500 (Homo sapiens);illumina Genome Analyzer IIx (Homo sapiens) |
|
GSE52244
|
Expression array |
15 |
[HuEx-1_0-st] Affymetrix Human Exon 1.0 ST Array [probe set (exon) version] |
|
GSE10789
|
Expression array |
6 |
NCI/ATC Hs-OperonV3 |
|
GSE224047
|
RNA-seq |
10 |
Illumina NextSeq 500 (Homo sapiens) |
|
GSE168557
|
Expression array |
6 |
Agilent-039494 SurePrint G3 Human GE v2 8x60K Microarray 039381 (Feature Number version) |
|
GSE136189
|
Methylation profiling (Array) |
40 |
Illumina HumanMethylation450 BeadChip (HumanMethylation450_15017482);Illumina Infinium HumanMethylation850 BeadChip |
When the gene can detect a peak in the dataset, a peak plot will be displayed.
> Dataset: GSE94732 - STIM2 peak across samples
|
Peak Plot
|
|
|
