Gene Information
|
Gene Name
|
SYN3 |
|
Gene ID
|
8224
|
|
Gene Full Name
|
synapsin III |
|
Gene Alias
|
- |
|
Transcripts
|
ENSG00000185666
|
|
Virus
|
HBV |
|
Gene Type
|
protein-coding |
|
HPA Location Info
|

|
|
Membrane Info
|
Plasma proteins, Predicted intracellular proteins |
|
Uniport_ID
|
O14994
|
|
HGNC ID
|
HGNC:11496
|
|
OMIM ID
|
602705 |
|
Summary
|
This gene is a member of the synapsin gene family. Synapsins encode neuronal phosphoproteins which associate with the cytoplasmic surface of synaptic vesicles. Family members are characterized by common protein domains, and they are implicated in synaptogenesis and the modulation of neurotransmitter release, suggesting a potential role in several neuropsychiatric diseases. The protein encoded by this gene shares the synapsin family domain model, with domains A, C, and E exhibiting the highest degree of conservation. The protein contains a unique domain J, located between domains C and E. Based on this gene's localization to 22q12.3, a possible schizophrenia susceptibility locus, and the established neurobiological roles of the synapsins, this family member may represent a candidate gene for schizophrenia. The TIMP3 gene is located within an intron of this gene and is transcribed in the opposite direction. Alternative splicing of this gene results in multiple splice variants that encode different isoforms. [provided by RefSeq, Oct 2008] |
Target gene [SYN3] related to VISs 
Integration Table: if previous studies reported that target gene was altered by virus integration events, the overlap between VISs in this literature and Cistrome factors was listed in this section
| DVID |
Chromosome |
HM |
TFBS |
CA |
Sum of Overlapped Records |
Detail |
| 1009272 |
chr22 |
16 |
0 |
0 |
16 |
View |
| 1017283 |
chr22 |
0 |
1 |
0 |
1 |
View |
| 1017586 |
chr22 |
0 |
0 |
0 |
0 |
View |
| 1023550 |
chr22 |
16 |
0 |
0 |
16 |
View |
| 1042710 |
chr22 |
17 |
2 |
0 |
19 |
View |
Target gene [SYN3] related to Omics data
| Data ID |
Experiment type |
Sample number |
Platform |
|
GSE236281
|
RNA-seq |
12 |
Illumina MiSeq (Homo sapiens) |
|
C GSE35465
|
Chip-seq;RNA-seq |
6 |
Illumina HiSeq 2000 (Homo sapiens) |
|
C GSE68402
|
Chip-seq |
26 |
Illumina MiSeq (Homo sapiens);Illumina HiSeq 2500 (Homo sapiens) |
|
S GSE247322
|
scRNA-seq |
27 |
Illumina NovaSeq 6000 (Homo sapiens) |
|
TCGA_LIHC_HBV
|
DNA methylation sequencing;RNA-seq |
97 |
TCGA |
|
C GSE270130
|
Chip-seq |
27 |
Illumina NovaSeq 6000 (Homo sapiens) |
|
GSE224901
|
RNA-seq |
21 |
Illumina NovaSeq 6000 (Homo sapiens) |
|
E GSE100400
|
Chip-seq;RNA-seq;4C_cccDNA |
31 |
Illumina NextSeq 500 (Homo sapiens);Illumina NextSeq 500 (Mus musculus) |
|
GSE173897
|
RNA-seq |
95 |
Illumina HiSeq 4000 (Homo sapiens) |
|
GSE262515
|
RNA-seq |
21 |
Illumina HiSeq 2500 (Homo sapiens);Illumina HiSeq 2500 (Mus musculus) |
|
GSE110345
|
RNA-seq |
4 |
Illumina HiSeq 2500 (Homo sapiens) |
|
C GSE131257
|
ATAC-seq;RNA-seq |
19 |
Illumina HiSeq 2500 (Homo sapiens) |
|
E GSE94660
|
RNA-seq |
42 |
Illumina HiSeq 2500 (Homo sapiens) |
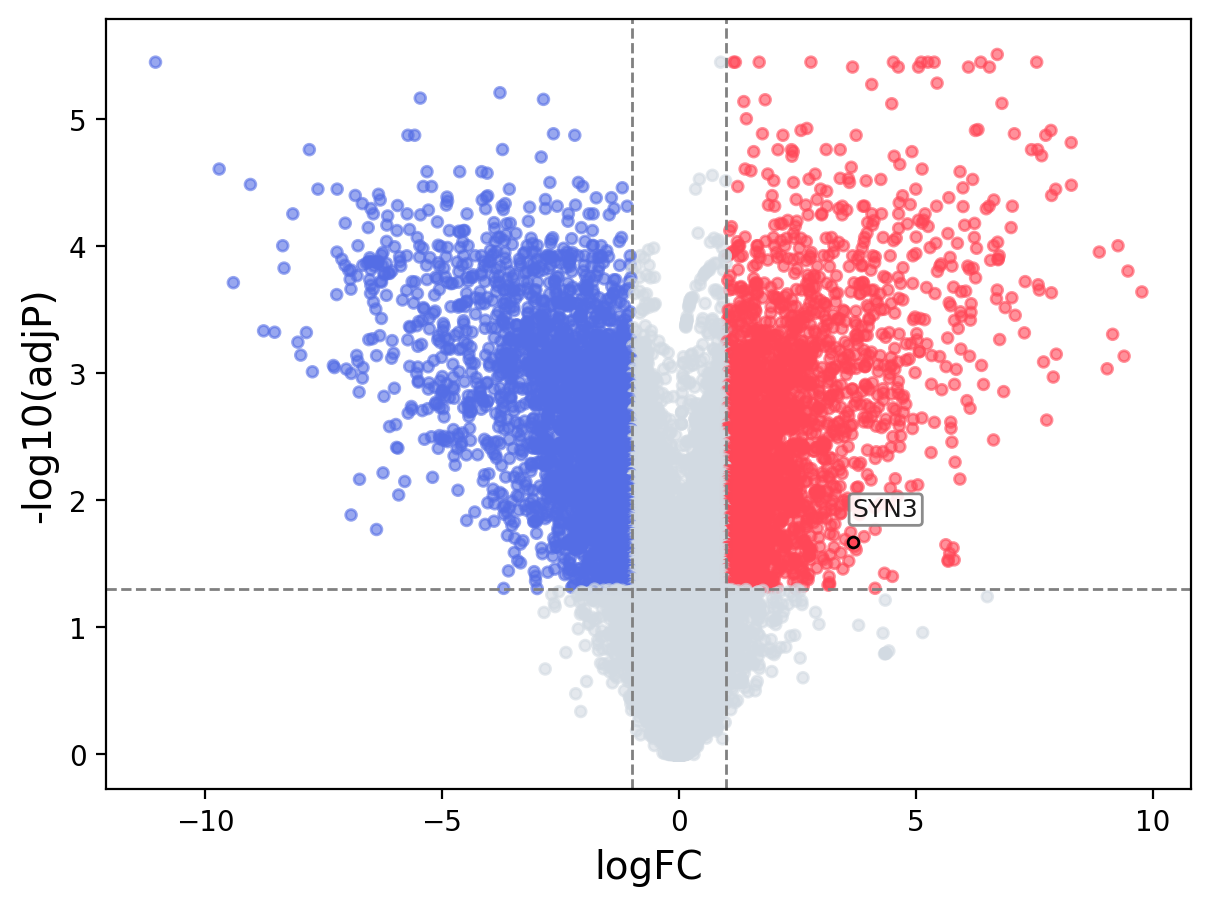
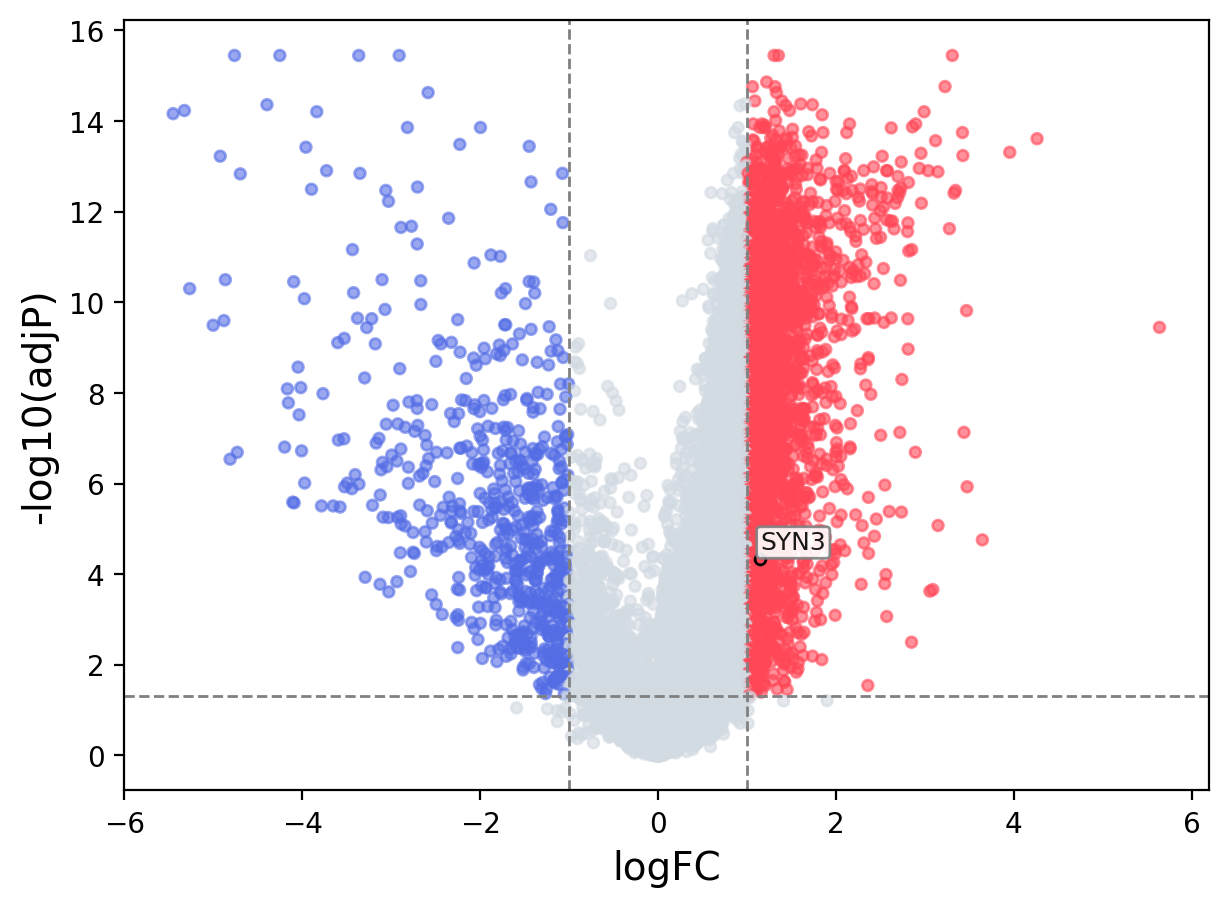
When the query gene is differentially changed in the dataset, a volcano/bar plot will be displayed.
> Dataset: GSE100400 - SYN3 expression across samples
|
Volcano Plot
|
Bar Plot
|
> Dataset: GSE94660 - SYN3 expression across samples
|
Volcano Plot
|
Bar Plot
|
|
|
