Gene Information
|
Gene Name
|
TASP1 |
|
Gene ID
|
55617
|
|
Gene Full Name
|
taspase 1 |
|
Gene Alias
|
C20orf13|SULEHS|dJ585I14.2 |
|
Transcripts
|
ENSG00000089123
|
|
Virus
|
HTLV1 |
|
Gene Type
|
protein-coding |
|
HPA Location Info
|
Plasma membrane; 
|
|
Membrane Info
|
Disease related genes, Predicted intracellular proteins |
|
Uniport_ID
|
Q9H6P5
|
|
HGNC ID
|
HGNC:15859
|
|
OMIM ID
|
608270 |
|
Summary
|
This gene encodes an endopeptidase that cleaves specific substrates following aspartate residues. The encoded protein undergoes posttranslational autoproteolytic processing to generate alpha and beta subunits, which reassemble into the active alpha2-beta2 heterotetramer. It is required to cleave MLL, a protein required for the maintenance of HOX gene expression, and TFIIA, a basal transcription factor. Alternatively spliced transcript variants have been described, but their biological validity has not been determined. [provided by RefSeq, Jul 2008] |
Target gene [TASP1] related to VISs 
Integration Table: if previous studies reported that target gene was altered by virus integration events, the overlap between VISs in this literature and Cistrome factors was listed in this section
Target gene [TASP1] related to Omics data
| Data ID |
Experiment type |
Sample number |
Platform |
|
GSE189602
|
Methylation profiling (Array) |
4 |
Infinium MethylationEPIC |
|
C GSE94732
|
Chip-seq |
24 |
Illumina NextSeq 500 (Homo sapiens);illumina Genome Analyzer IIx (Homo sapiens) |
|
GSE52244
|
Expression array |
15 |
[HuEx-1_0-st] Affymetrix Human Exon 1.0 ST Array [probe set (exon) version] |
|
GSE10789
|
Expression array |
6 |
NCI/ATC Hs-OperonV3 |
|
GSE224047
|
RNA-seq |
10 |
Illumina NextSeq 500 (Homo sapiens) |
|
GSE168557
|
Expression array |
6 |
Agilent-039494 SurePrint G3 Human GE v2 8x60K Microarray 039381 (Feature Number version) |
|
GSE136189
|
Methylation profiling (Array) |
40 |
Illumina HumanMethylation450 BeadChip (HumanMethylation450_15017482);Illumina Infinium HumanMethylation850 BeadChip |
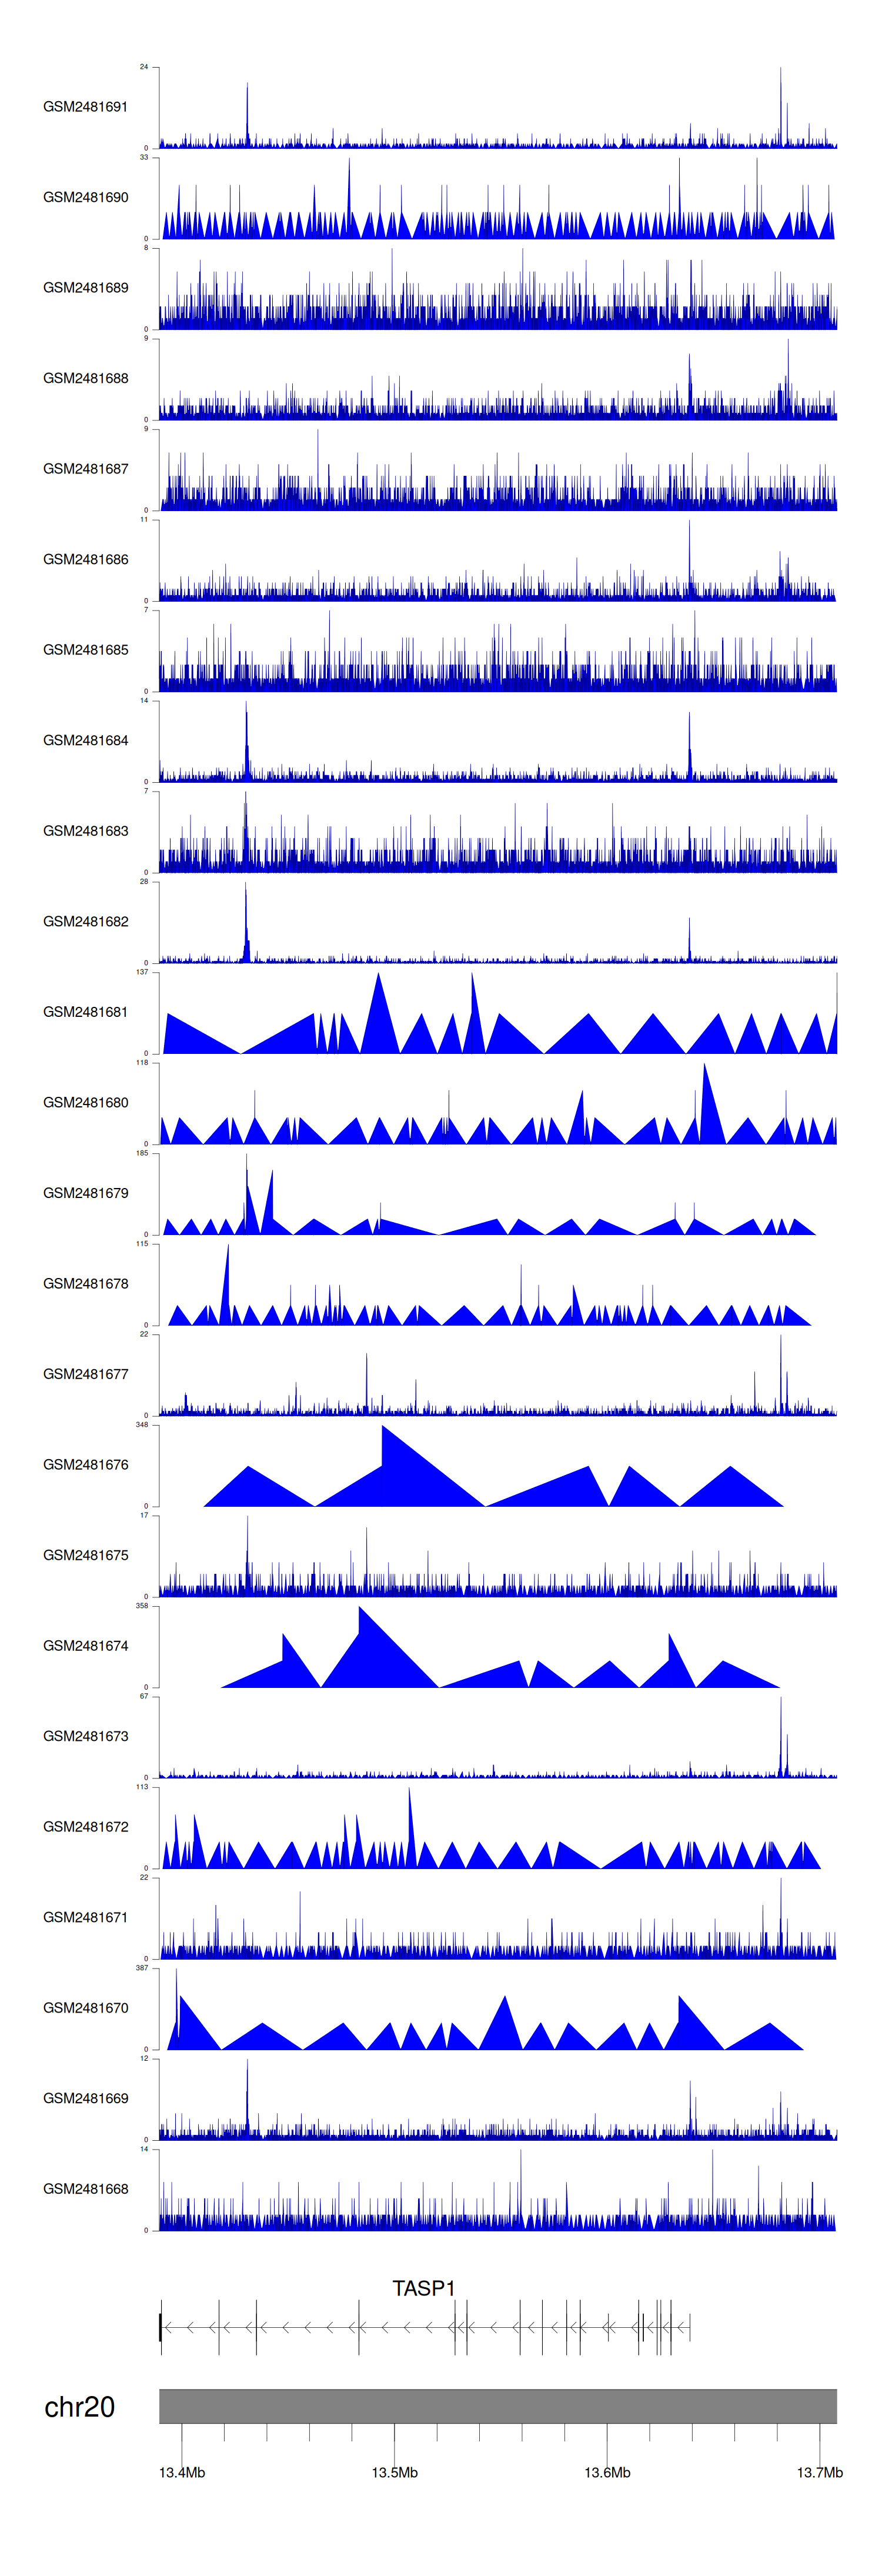
When the gene can detect a peak in the dataset, a peak plot will be displayed.
> Dataset: GSE94732 - TASP1 peak across samples
|
Peak Plot
|
|
|
