Gene Information
|
Gene Name
|
TECR |
|
Gene ID
|
9524
|
|
Gene Full Name
|
trans-2,3-enoyl-CoA reductase |
|
Gene Alias
|
GPSN2|MRT14|SC2|TER |
|
Transcripts
|
ENSG00000099797
|
|
Virus
|
HTLV1 |
|
Gene Type
|
protein-coding |
|
HPA Location Info
|
Endoplasmic reticulum; 
|
|
Membrane Info
|
Disease related genes, Enzymes, Human disease related genes, Metabolic proteins, Potential drug targets, Predicted membrane proteins |
|
Uniport_ID
|
Q9NZ01
|
|
HGNC ID
|
HGNC:4551
|
|
OMIM ID
|
610057 |
|
Summary
|
This gene encodes a multi-pass membrane protein that resides in the endoplasmic reticulum, and belongs to the steroid 5-alpha reductase family. The elongation of microsomal long and very long chain fatty acid consists of 4 sequential reactions. This protein catalyzes the final step, reducing trans-2,3-enoyl-CoA to saturated acyl-CoA. Alternatively spliced transcript variants have been found for this gene.[provided by RefSeq, Apr 2011] |
Target gene [TECR] related to VISs 
Integration Table: if previous studies reported that target gene was altered by virus integration events, the overlap between VISs in this literature and Cistrome factors was listed in this section
| DVID |
Chromosome |
HM |
TFBS |
CA |
Sum of Overlapped Records |
Detail |
| 6014705 |
chr19 |
11 |
4 |
1 |
16 |
View |
Target gene [TECR] related to Omics data
| Data ID |
Experiment type |
Sample number |
Platform |
|
GSE189602
|
Methylation profiling (Array) |
4 |
Infinium MethylationEPIC |
|
C GSE94732
|
Chip-seq |
24 |
Illumina NextSeq 500 (Homo sapiens);illumina Genome Analyzer IIx (Homo sapiens) |
|
GSE52244
|
Expression array |
15 |
[HuEx-1_0-st] Affymetrix Human Exon 1.0 ST Array [probe set (exon) version] |
|
GSE10789
|
Expression array |
6 |
NCI/ATC Hs-OperonV3 |
|
GSE224047
|
RNA-seq |
10 |
Illumina NextSeq 500 (Homo sapiens) |
|
GSE168557
|
Expression array |
6 |
Agilent-039494 SurePrint G3 Human GE v2 8x60K Microarray 039381 (Feature Number version) |
|
GSE136189
|
Methylation profiling (Array) |
40 |
Illumina HumanMethylation450 BeadChip (HumanMethylation450_15017482);Illumina Infinium HumanMethylation850 BeadChip |
When the gene can detect a peak in the dataset, a peak plot will be displayed.
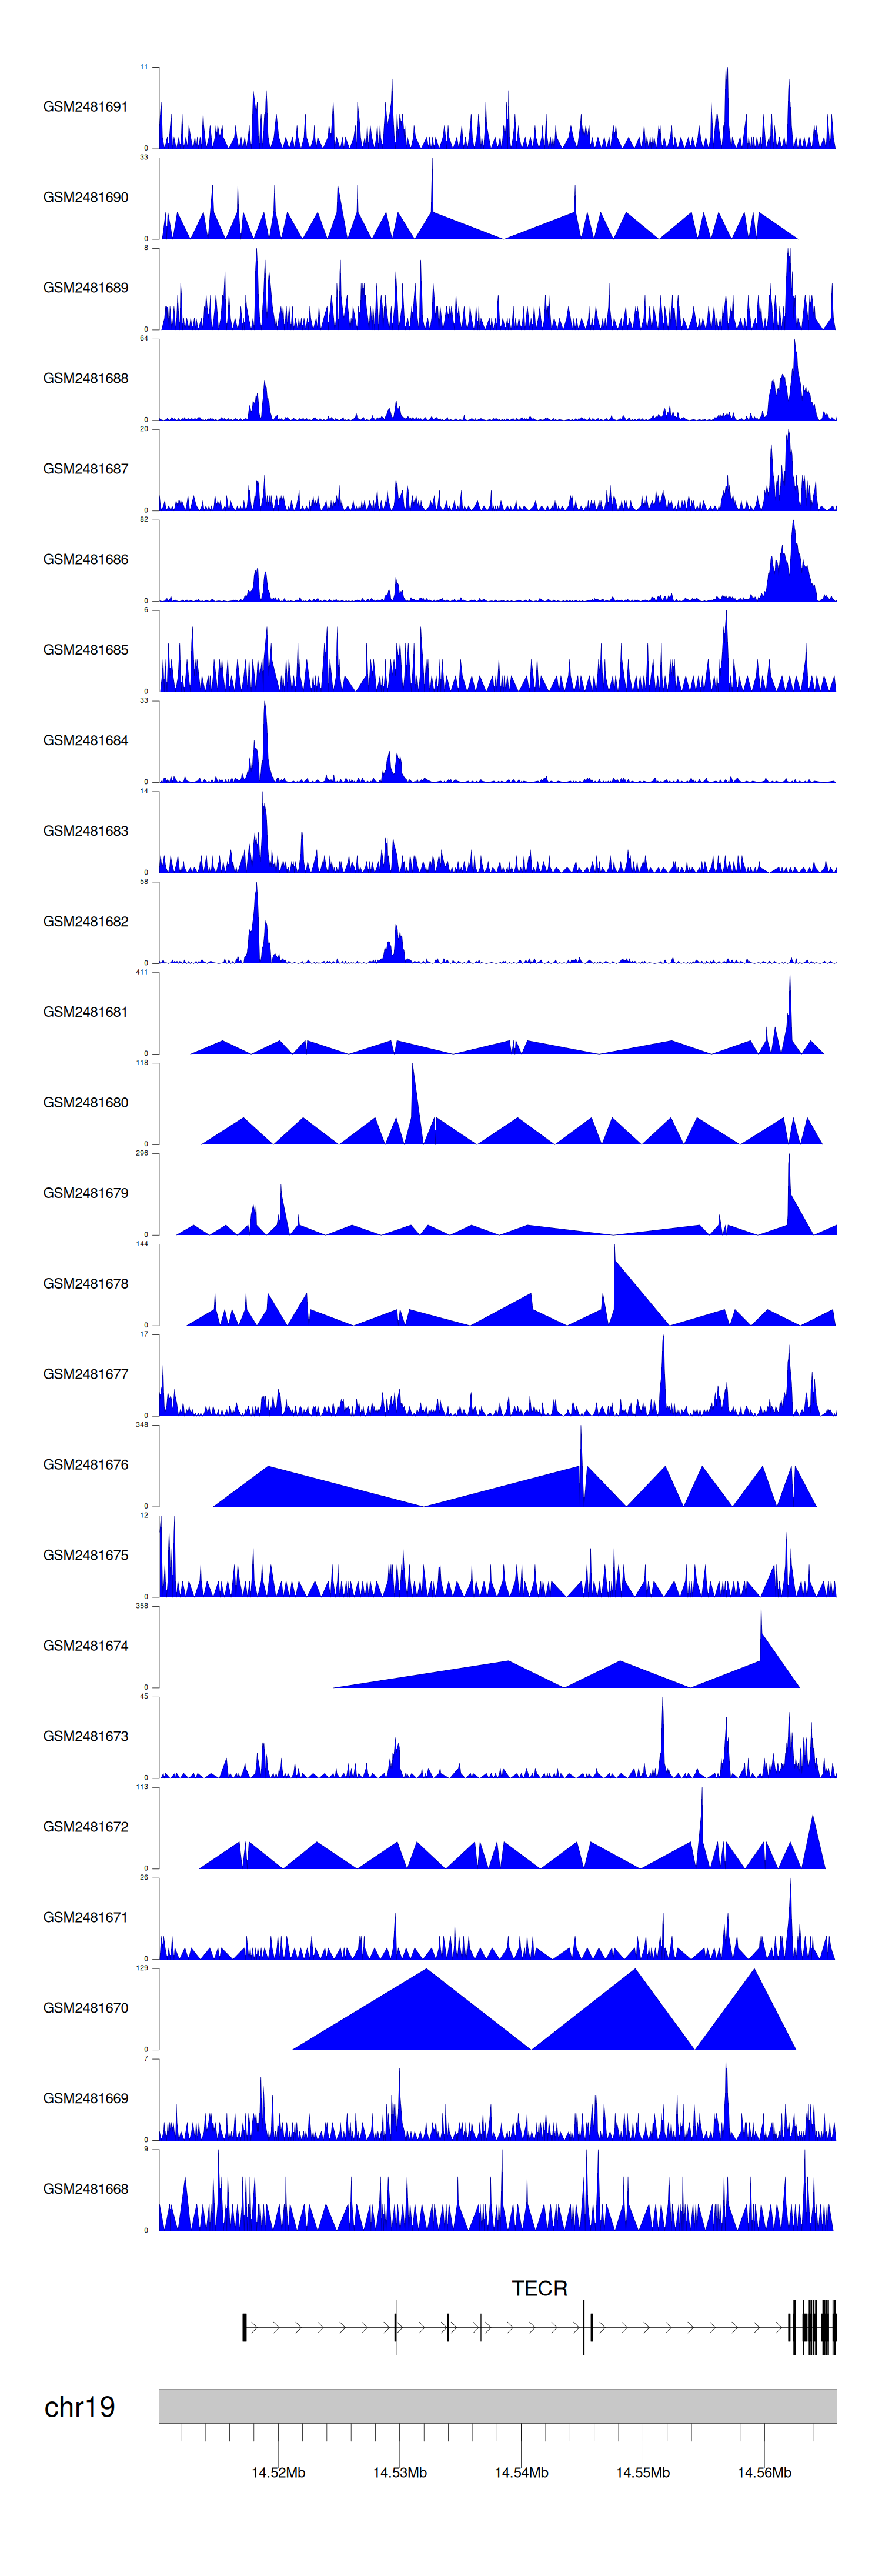
> Dataset: GSE94732 - TECR peak across samples
|
Peak Plot
|
|
|
