|
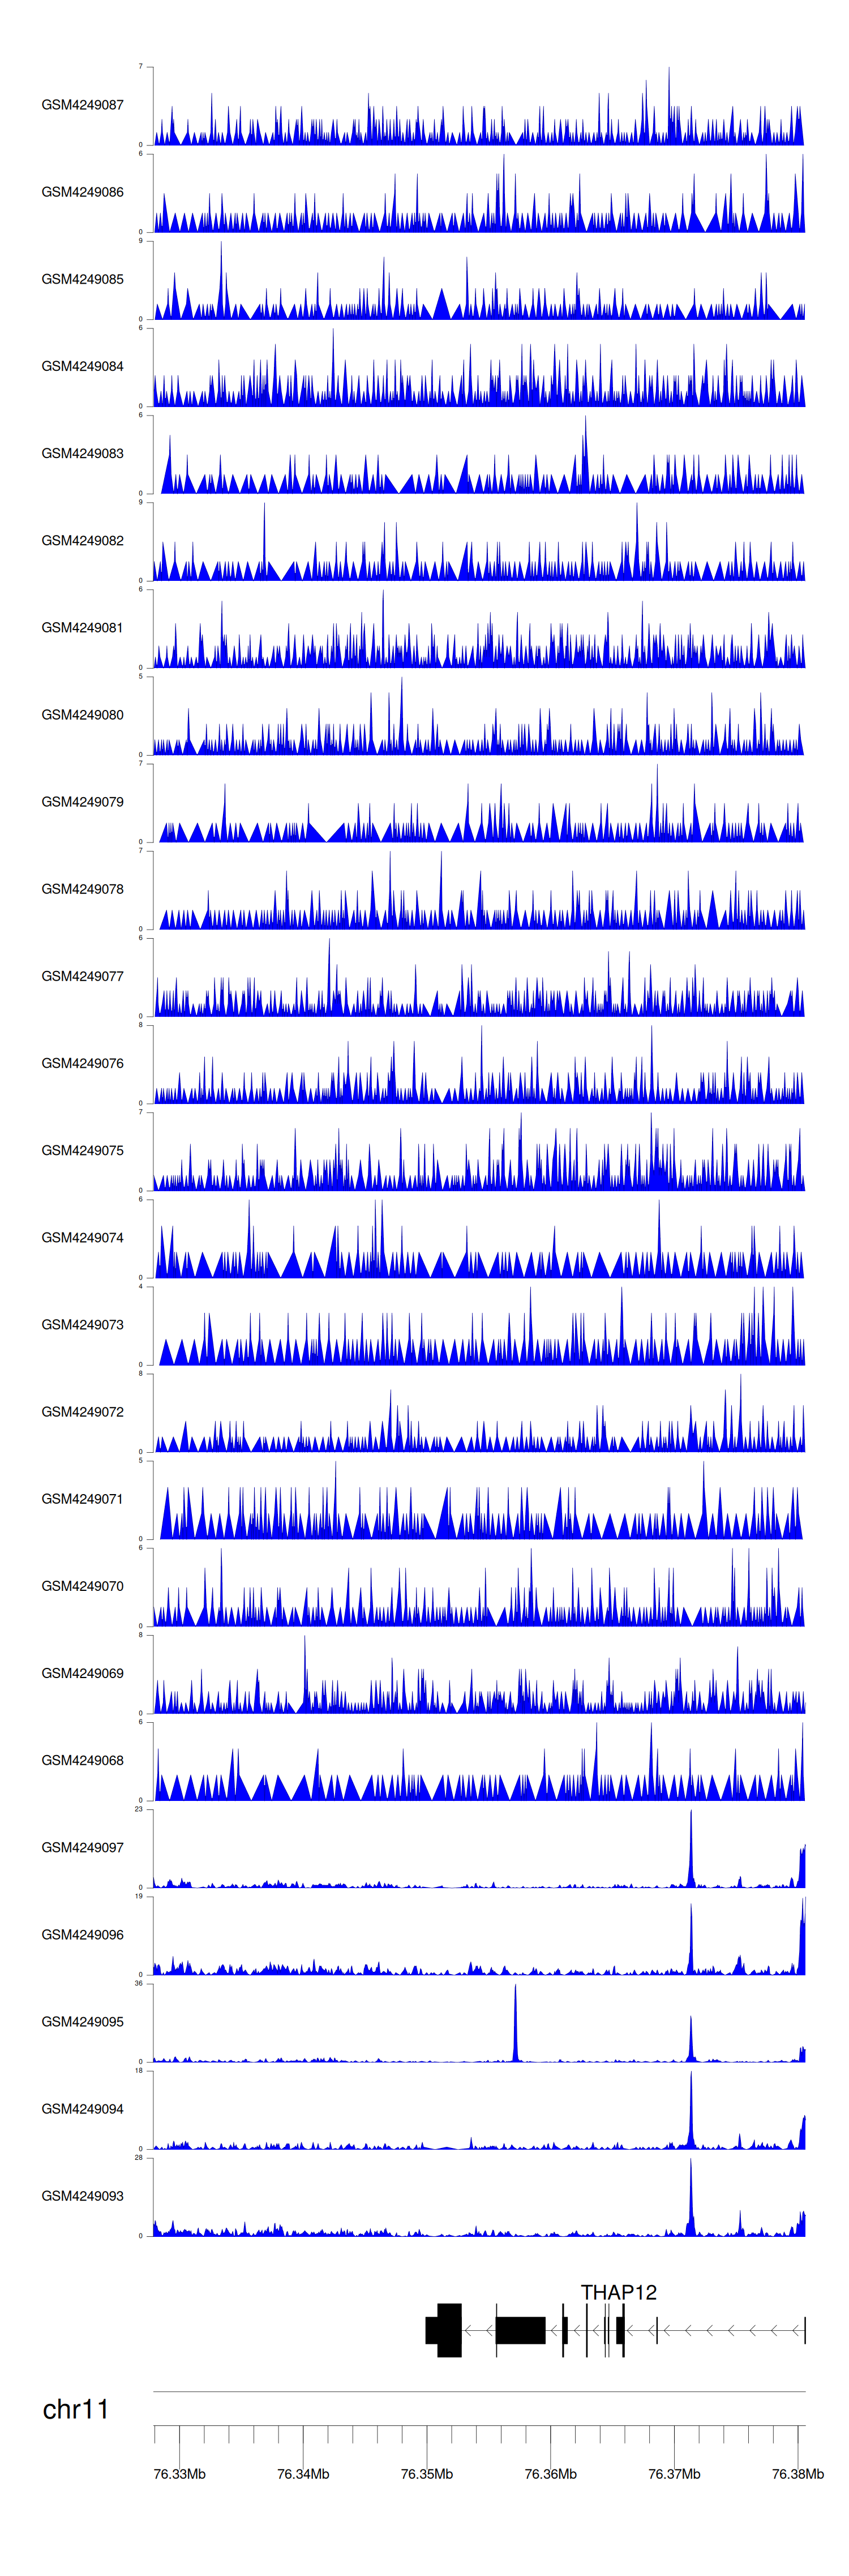
C GSE183048
|
Chip-seq |
24 |
Illumina HiSeq 4000 (Homo sapiens) |
|
GSE65858
|
Expression array |
270 |
Illumina HumanHT-12 V4.0 expression beadchip |
|
GSE181805
|
Expression array |
25 |
[HTA-2_0] Affymetrix Human Transcriptome Array 2.0 [transcript (gene) version] |
|
GSE138080
|
Expression array |
35 |
Agilent-014850 Whole Human Genome Microarray 4x44K G4112F (Feature Number version) |
|
GSE140662
|
Expression array |
8 |
[HTA-2_0] Affymetrix Human Transcriptome Array 2.0 [transcript (gene) version] |
|
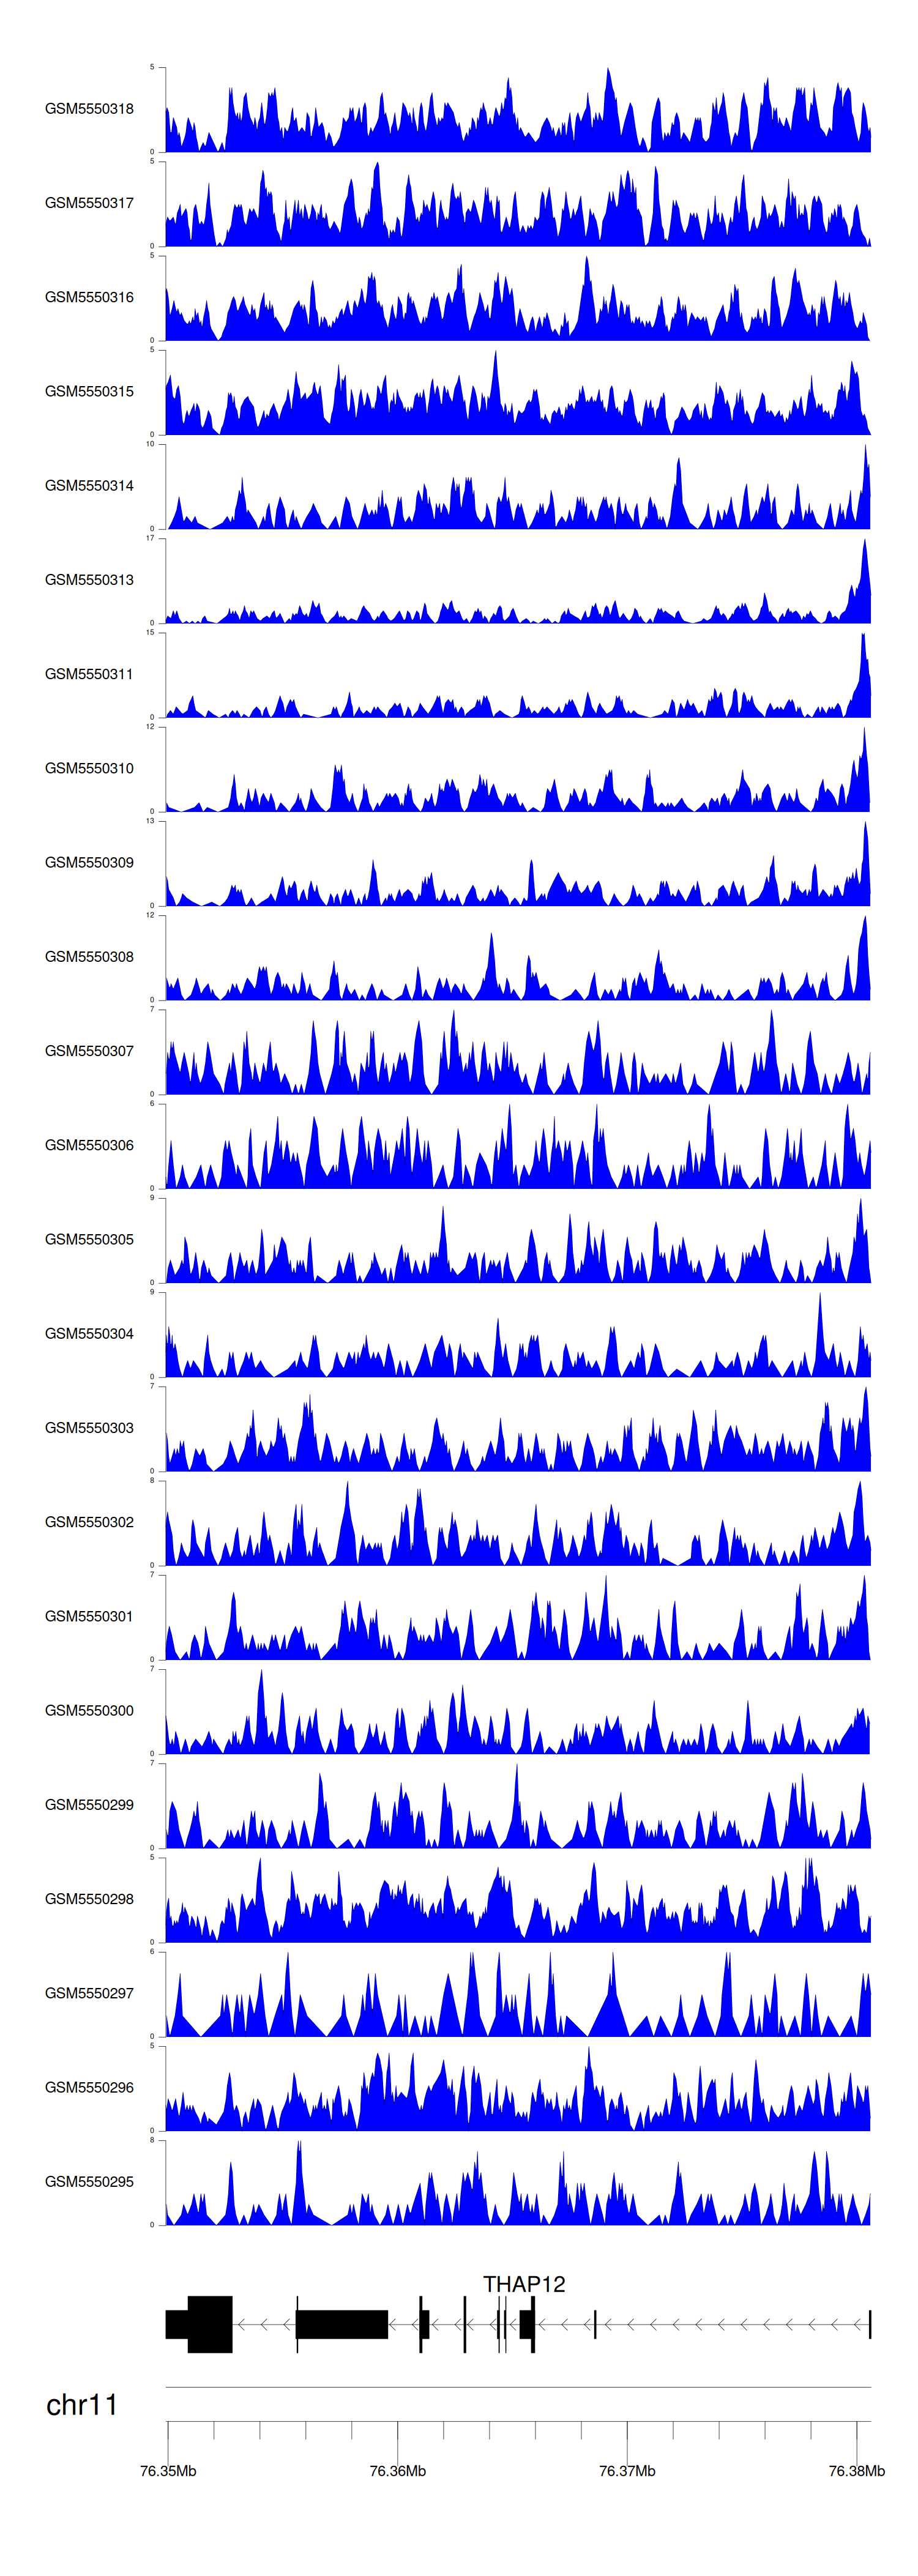
C GSE143026
|
ATAC-seq;Chip-seq;RNA-seq |
30 |
Illumina HiSeq 2500 (Homo sapiens) |
|
TCGA_CESC
|
DNA methylation sequencing;RNA-seq |
288 |
TCGA |
|
GSE51993
|
Expression array |
48 |
Illumina Human v2 MicroRNA expression beadchip;Illumina HumanHT-12 V4.0 expression beadchip |