Gene Information
|
Gene Name
|
TSPAN12 |
|
Gene ID
|
23554
|
|
Gene Full Name
|
tetraspanin 12 |
|
Gene Alias
|
EVR5|NET-2|NET2|TM4SF12 |
|
Transcripts
|
ENSG00000106025
|
|
Virus
|
HTLV1 |
|
Gene Type
|
protein-coding |
|
HPA Location Info
|
Microtubules;Vesicles; 
|
|
Membrane Info
|
Disease related genes, Human disease related genes, Potential drug targets, Predicted membrane proteins, Transporters |
|
Uniport_ID
|
O95859
|
|
HGNC ID
|
HGNC:21641
|
|
OMIM ID
|
613138 |
|
Summary
|
The protein encoded by this gene is a member of the transmembrane 4 superfamily, also known as the tetraspanin family. Most of these members are cell-surface proteins that are characterized by the presence of four hydrophobic domains. The proteins mediate signal transduction events that play a role in the regulation of cell development, activation, growth and motility. [provided by RefSeq, Jul 2008] |
Target gene [TSPAN12] related to VISs 
Integration Table: if previous studies reported that target gene was altered by virus integration events, the overlap between VISs in this literature and Cistrome factors was listed in this section
| DVID |
Chromosome |
HM |
TFBS |
CA |
Sum of Overlapped Records |
Detail |
| 6030353 |
chr7 |
1 |
0 |
0 |
1 |
View |
Target gene [TSPAN12] related to Omics data
| Data ID |
Experiment type |
Sample number |
Platform |
|
C GSE94732
|
Chip-seq |
24 |
Illumina NextSeq 500 (Homo sapiens);illumina Genome Analyzer IIx (Homo sapiens) |
|
GSE168557
|
Expression array |
6 |
Agilent-039494 SurePrint G3 Human GE v2 8x60K Microarray 039381 (Feature Number version) |
|
GSE52244
|
Expression array |
15 |
[HuEx-1_0-st] Affymetrix Human Exon 1.0 ST Array [probe set (exon) version] |
|
GSE10789
|
Expression array |
6 |
NCI/ATC Hs-OperonV3 |
|
GSE189602
|
Methylation profiling (Array) |
4 |
Infinium MethylationEPIC |
|
GSE136189
|
Methylation profiling (Array) |
40 |
Illumina HumanMethylation450 BeadChip (HumanMethylation450_15017482);Illumina Infinium HumanMethylation850 BeadChip |
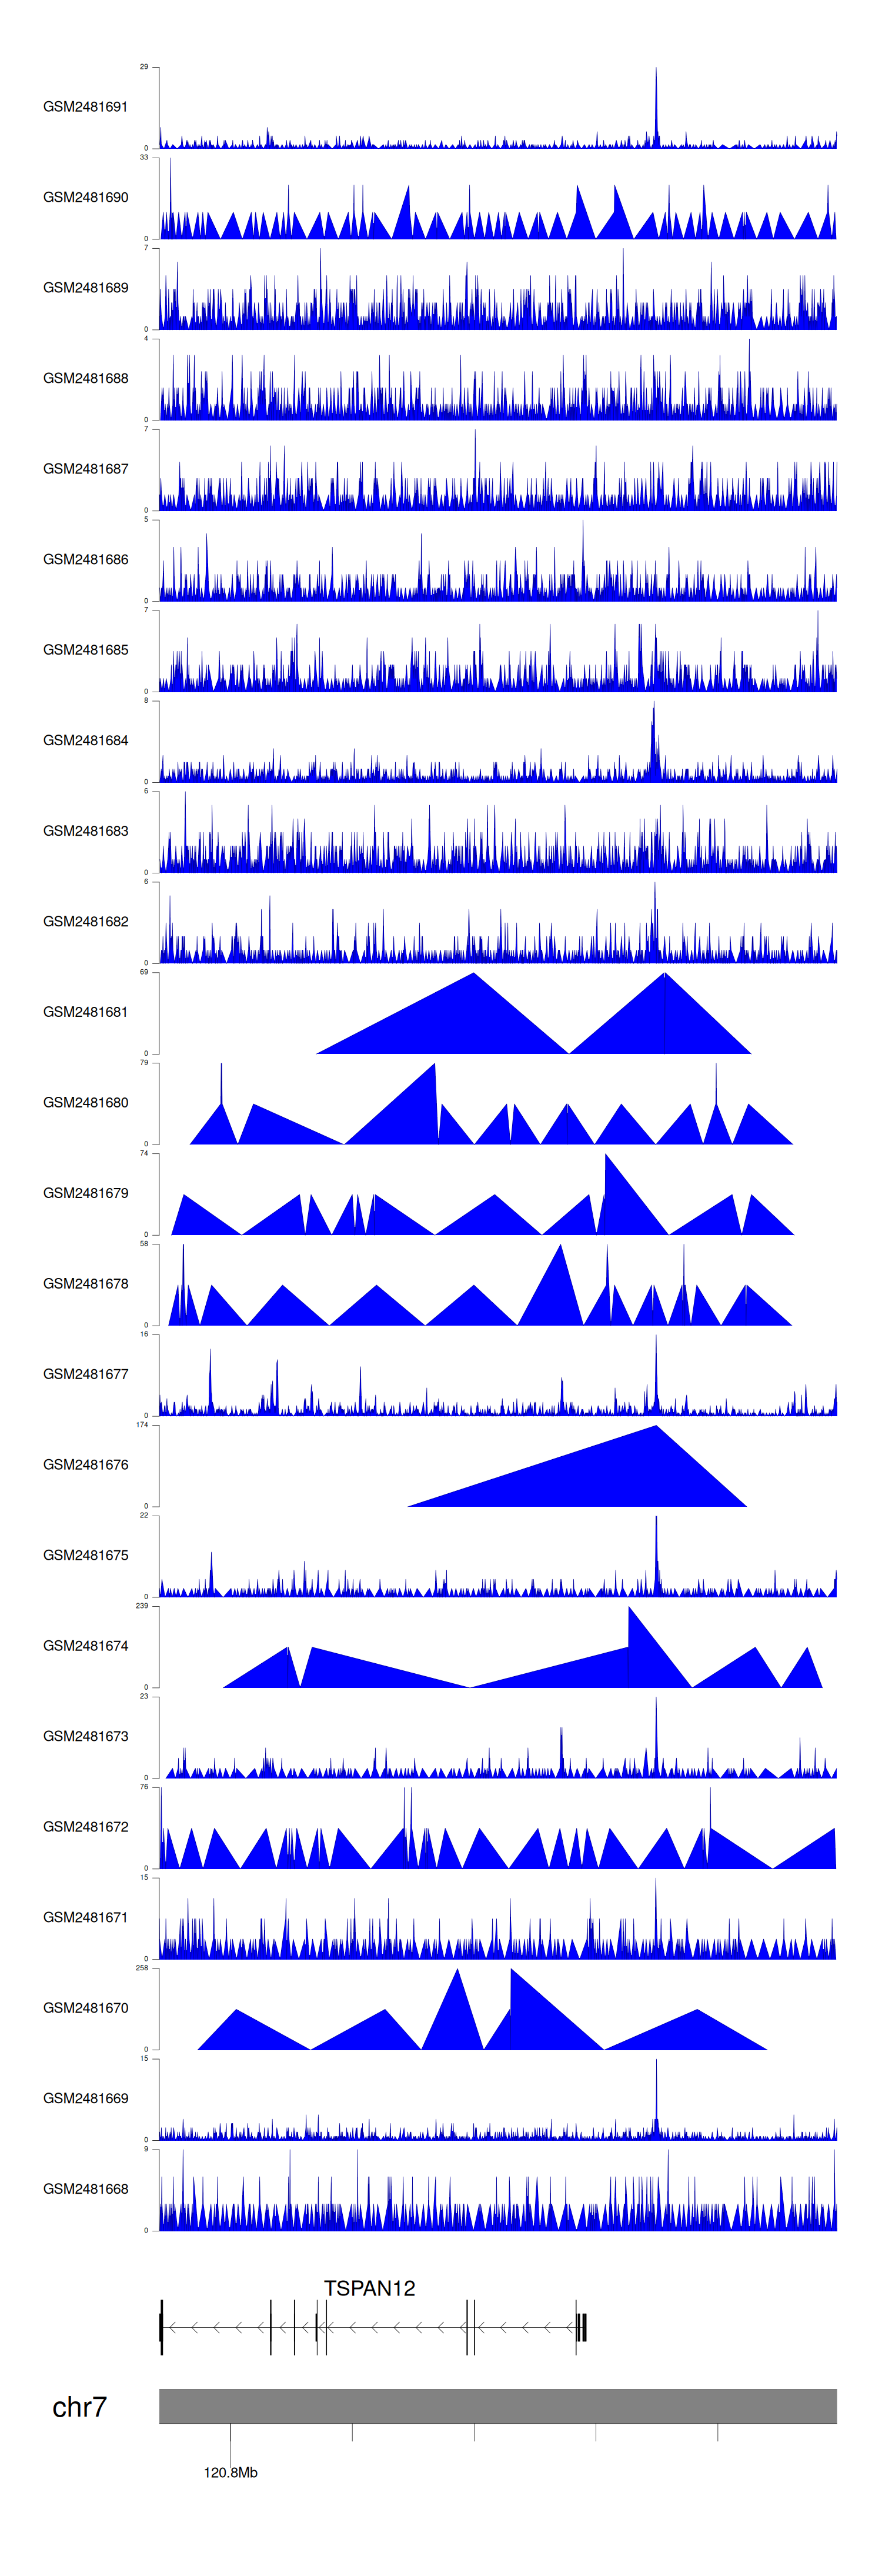
When the gene can detect a peak in the dataset, a peak plot will be displayed.
> Dataset: GSE94732 - TSPAN12 peak across samples
|
Peak Plot
|
|
|
