Gene Information
|
Gene Name
|
UBE3A |
|
Gene ID
|
7337
|
|
Gene Full Name
|
ubiquitin protein ligase E3A |
|
Gene Alias
|
ANCR|AS|E6-AP|EPVE6AP|HPVE6A|PIX1 |
|
Transcripts
|
ENSG00000114062
|
|
Virus
|
HBV |
|
Gene Type
|
protein-coding |
|
HPA Location Info
|
Nucleoplasm;Cytosol; 
|
|
Membrane Info
|
Disease related genes, Enzymes, Human disease related genes, Metabolic proteins, Potential drug targets, Predicted intracellular proteins, Predicted membrane proteins |
|
Uniport_ID
|
Q05086
|
|
HGNC ID
|
HGNC:12496
|
|
OMIM ID
|
601623 |
|
Summary
|
This gene encodes an E3 ubiquitin-protein ligase, part of the ubiquitin protein degradation system. This imprinted gene is maternally expressed in brain and biallelically expressed in other tissues. Maternally inherited deletion of this gene causes Angelman Syndrome, characterized by severe motor and intellectual retardation, ataxia, hypotonia, epilepsy, absence of speech, and characteristic facies. The protein also interacts with the E6 protein of human papillomavirus types 16 and 18, resulting in ubiquitination and proteolysis of tumor protein p53. Alternative splicing of this gene results in three transcript variants encoding three isoforms with different N-termini. Additional transcript variants have been described, but their full length nature has not been determined. [provided by RefSeq, Jul 2008] |
Target gene [UBE3A] related to VISs 
Integration Table: if previous studies reported that target gene was altered by virus integration events, the overlap between VISs in this literature and Cistrome factors was listed in this section
| DVID |
Chromosome |
HM |
TFBS |
CA |
Sum of Overlapped Records |
Detail |
| 1011644 |
chr15 |
7 |
1 |
0 |
8 |
View |
| 1020940 |
chr15 |
7 |
1 |
0 |
8 |
View |
| 1042112 |
chr15 |
35 |
3 |
3 |
41 |
View |
Target gene [UBE3A] related to Omics data
| Data ID |
Experiment type |
Sample number |
Platform |
|
GSE236281
|
RNA-seq |
12 |
Illumina MiSeq (Homo sapiens) |
|
C GSE35465
|
Chip-seq;RNA-seq |
6 |
Illumina HiSeq 2000 (Homo sapiens) |
|
C GSE68402
|
Chip-seq |
26 |
Illumina MiSeq (Homo sapiens);Illumina HiSeq 2500 (Homo sapiens) |
|
GSE247322
|
scRNA-seq |
27 |
Illumina NovaSeq 6000 (Homo sapiens) |
|
TCGA_LIHC_HBV
|
DNA methylation sequencing;RNA-seq |
97 |
TCGA |
|
C GSE270130
|
Chip-seq |
27 |
Illumina NovaSeq 6000 (Homo sapiens) |
|
GSE224901
|
RNA-seq |
21 |
Illumina NovaSeq 6000 (Homo sapiens) |
|
C GSE100400
|
Chip-seq;RNA-seq;4C_cccDNA |
31 |
Illumina NextSeq 500 (Homo sapiens);Illumina NextSeq 500 (Mus musculus) |
|
GSE173897
|
RNA-seq |
95 |
Illumina HiSeq 4000 (Homo sapiens) |
|
GSE262515
|
RNA-seq |
21 |
Illumina HiSeq 2500 (Homo sapiens);Illumina HiSeq 2500 (Mus musculus) |
|
GSE110345
|
RNA-seq |
4 |
Illumina HiSeq 2500 (Homo sapiens) |
|
C GSE131257
|
ATAC-seq;RNA-seq |
19 |
Illumina HiSeq 2500 (Homo sapiens) |
|
GSE94660
|
RNA-seq |
42 |
Illumina HiSeq 2500 (Homo sapiens) |
When the gene can detect a peak in the dataset, a peak plot will be displayed.
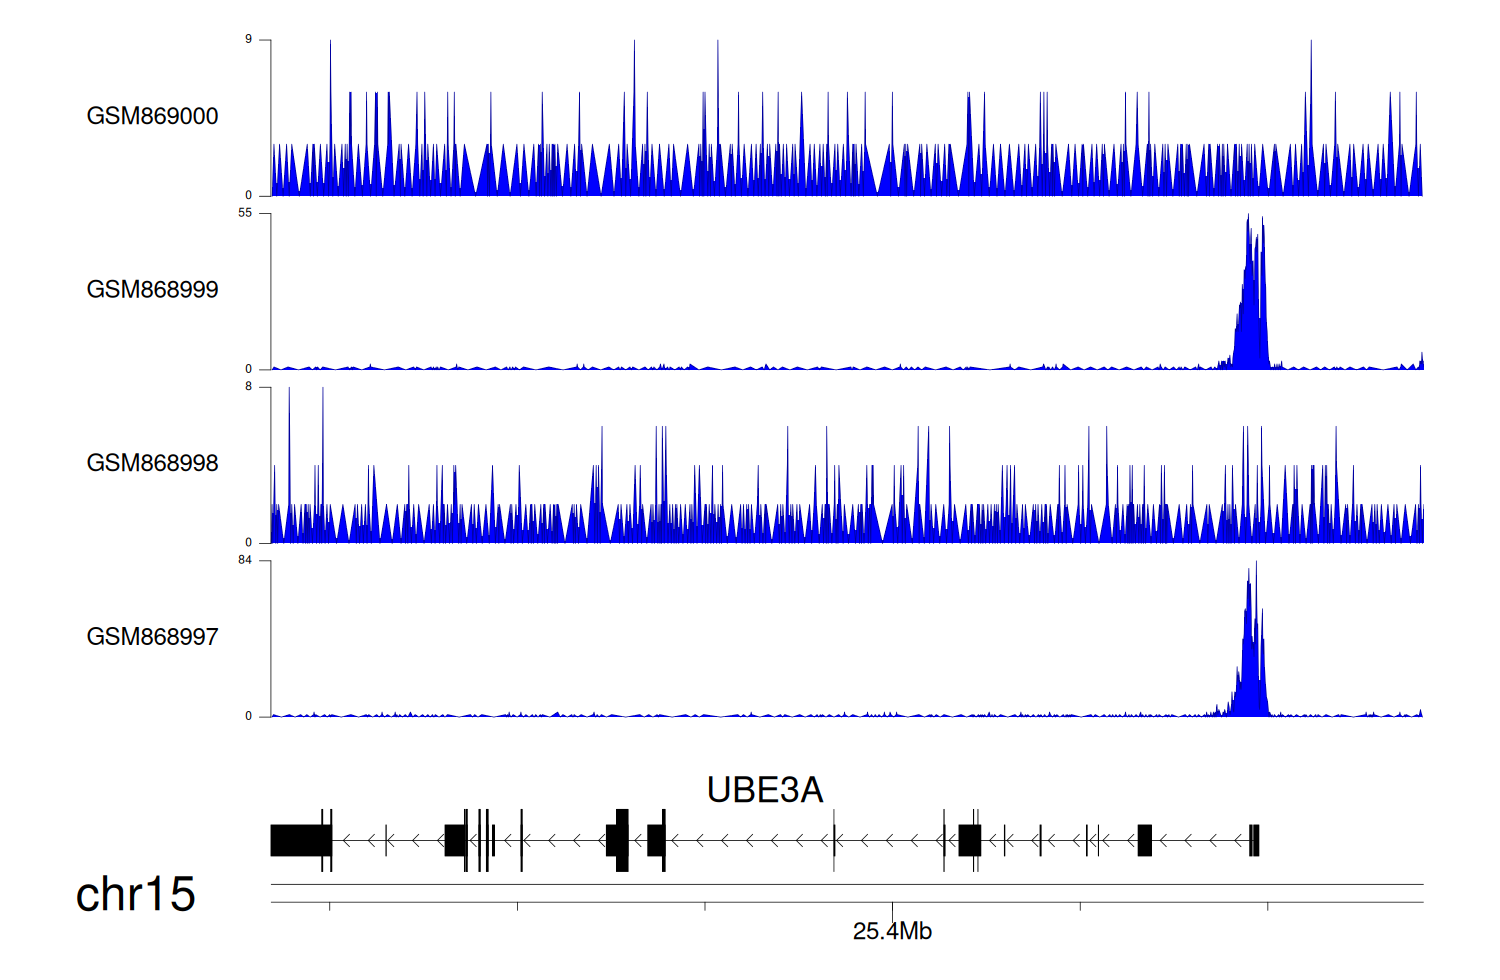
> Dataset: GSE35465 - UBE3A peak across samples
|
Peak Plot
|
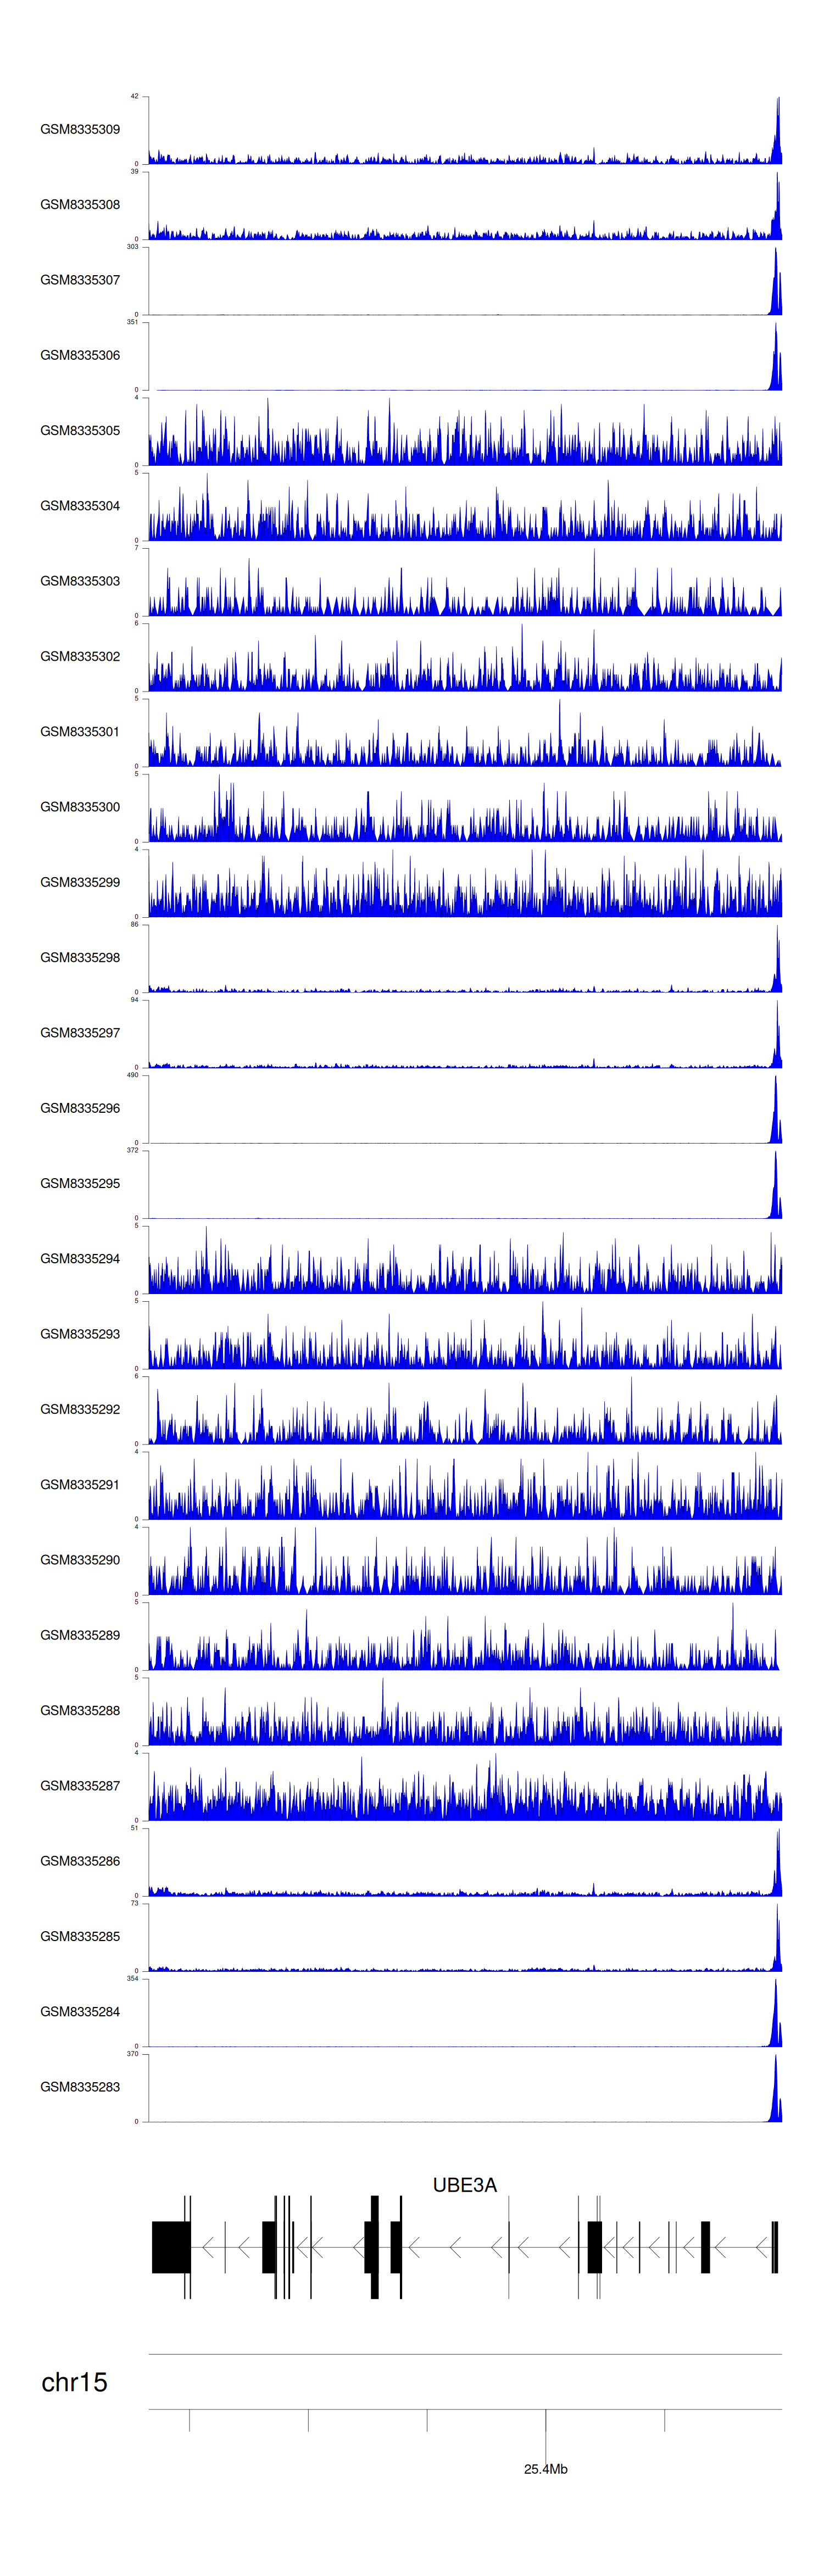
> Dataset: GSE68402 - UBE3A peak across samples
|
Peak Plot

|
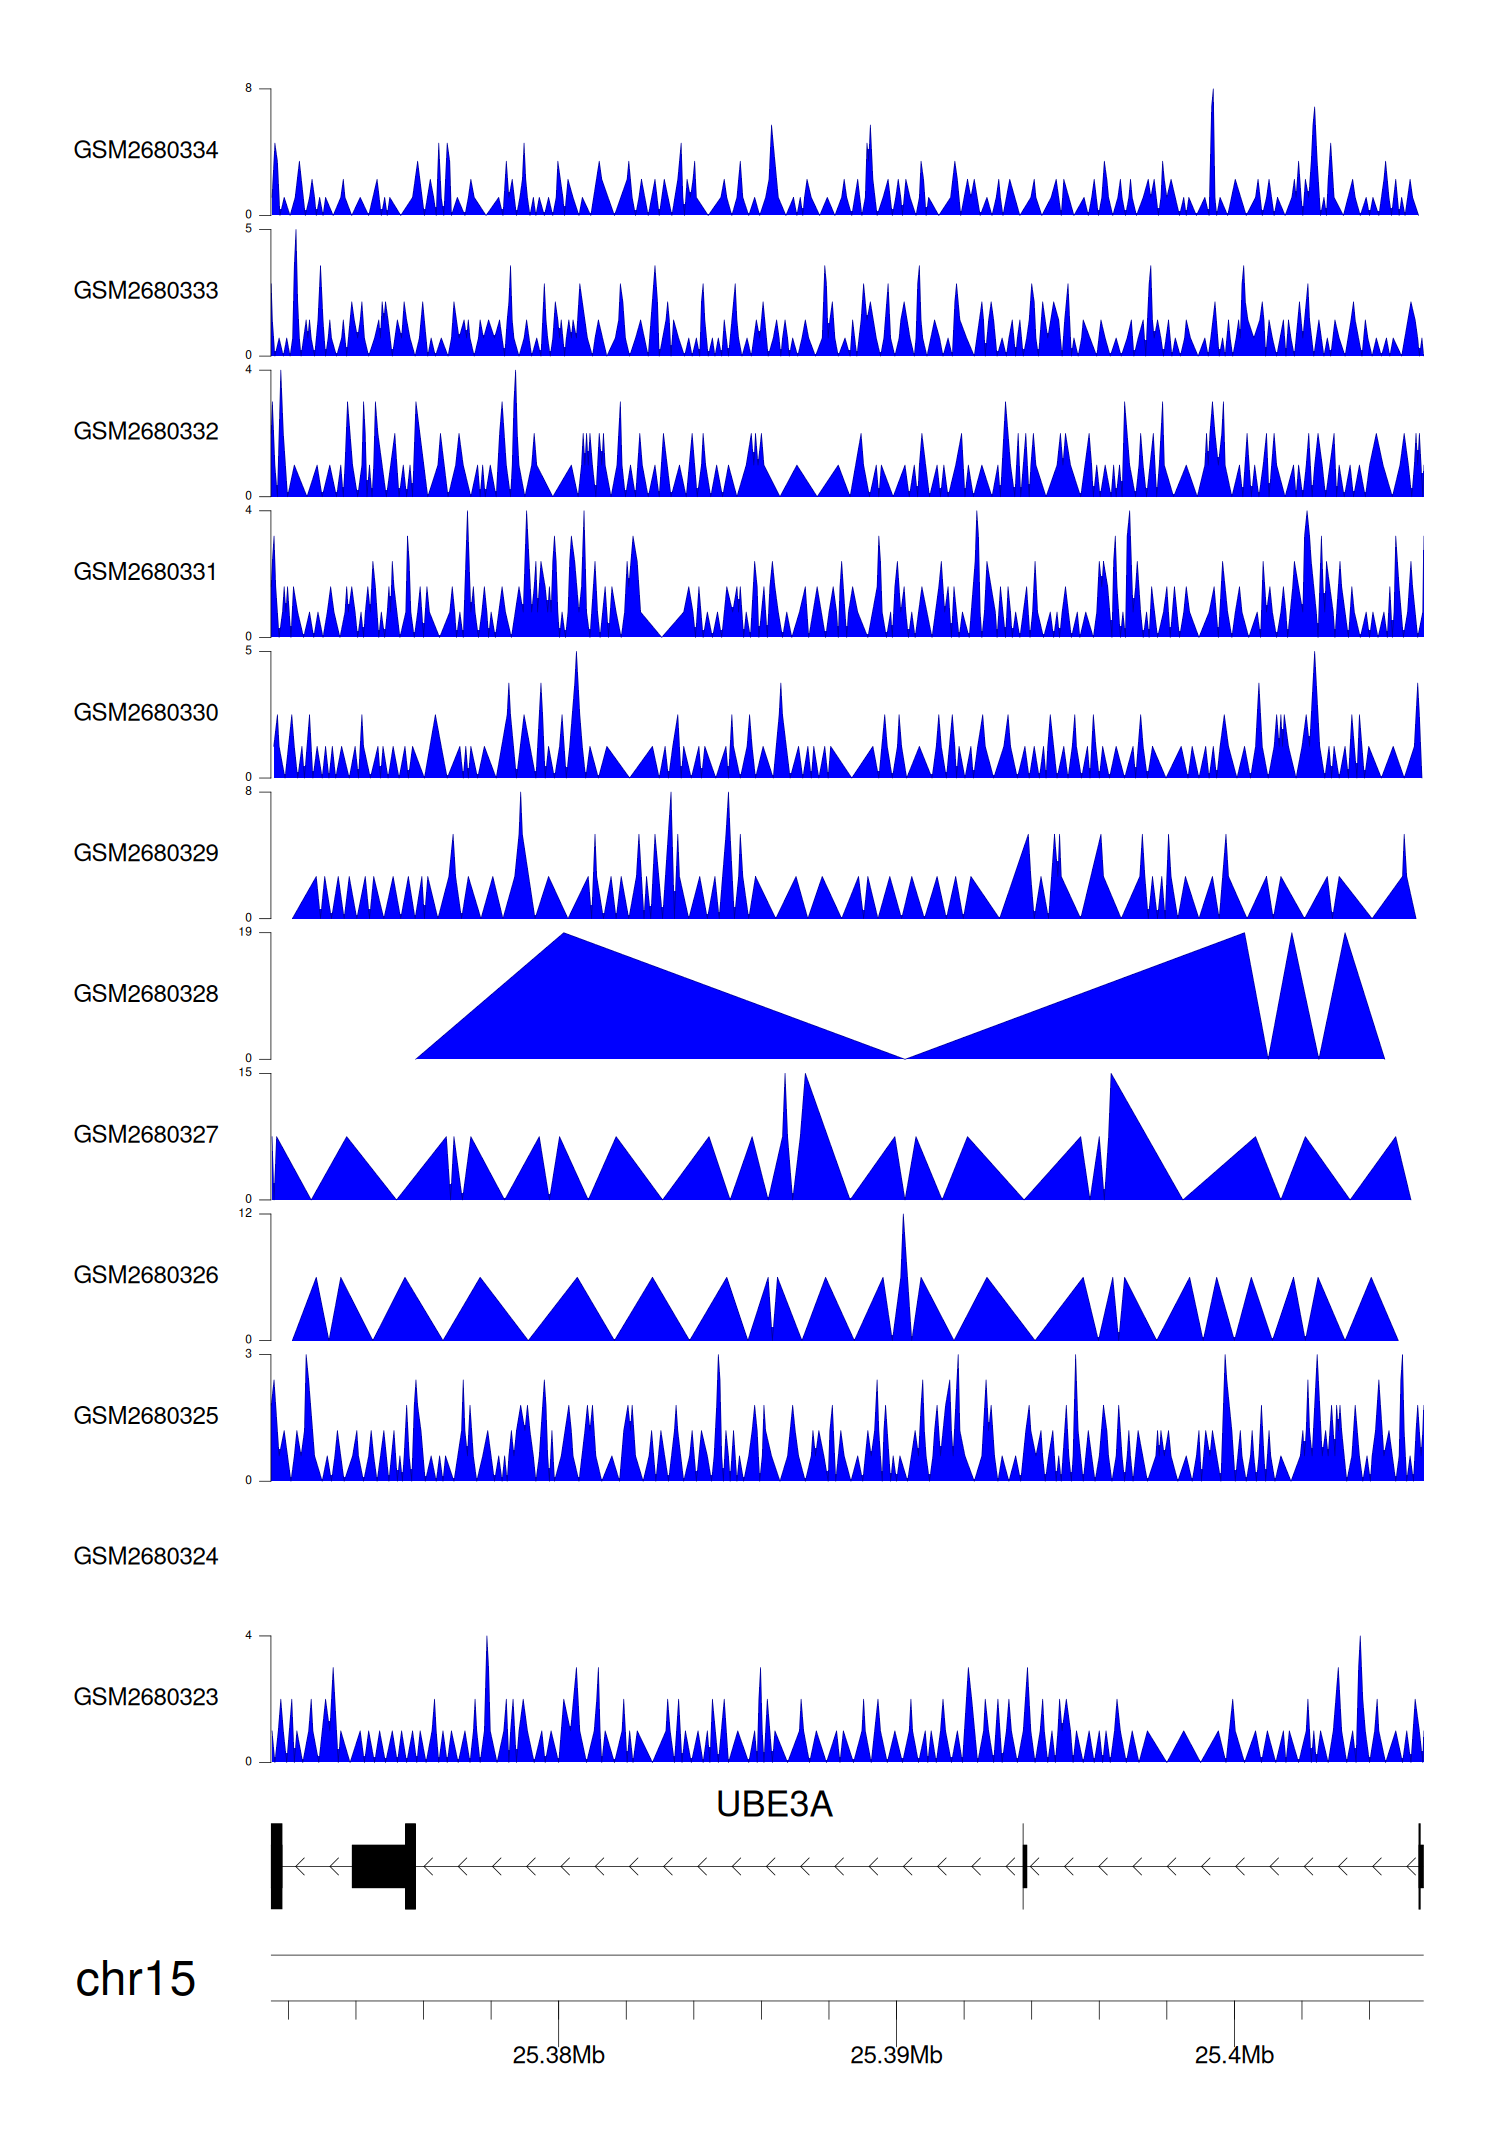
> Dataset: GSE270130 - UBE3A peak across samples
|
Peak Plot
|
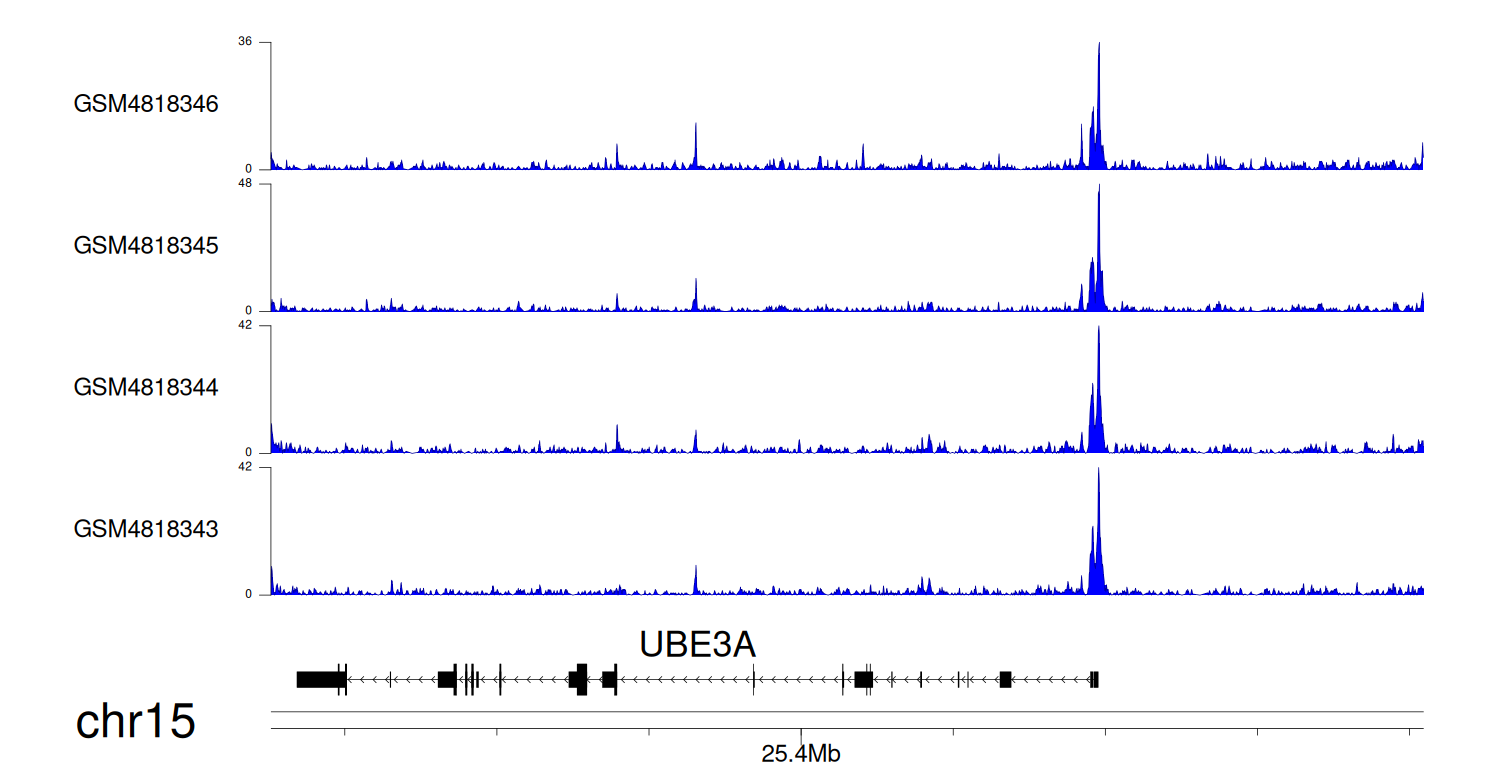
> Dataset: GSE100400 - UBE3A peak across samples
|
Peak Plot
|
> Dataset: GSE131257 - UBE3A peak across samples
|
Peak Plot
|
|
|
