Gene Information
|
Gene Name
|
ARHGAP15 |
|
Gene ID
|
55843
|
|
Gene Full Name
|
Rho GTPase activating protein 15 |
|
Gene Alias
|
BM046 |
|
Transcripts
|
ENSG00000075884
|
|
Virus
|
HTLV1 |
|
Gene Type
|
protein-coding |
|
HPA Location Info
|
Plasma membrane; 
|
|
Membrane Info
|
Predicted intracellular proteins |
|
Uniport_ID
|
Q53QZ3
|
|
HGNC ID
|
HGNC:21030
|
|
OMIM ID
|
610578 |
|
Summary
|
RHO GTPases (see ARHA; MIM 165390) regulate diverse biologic processes, and their activity is regulated by RHO GTPase-activating proteins (GAPs), such as ARHGAP15 (Seoh et al., 2003 [PubMed 12650940]).[supplied by OMIM, Mar 2008] |
Target gene [ARHGAP15] related to VISs 
Integration Table: if previous studies reported that target gene was altered by virus integration events, the overlap between VISs in this literature and Cistrome factors was listed in this section
Target gene [ARHGAP15] related to Omics data
| Data ID |
Experiment type |
Sample number |
Platform |
|
GSE189602
|
Methylation profiling (Array) |
4 |
Infinium MethylationEPIC |
|
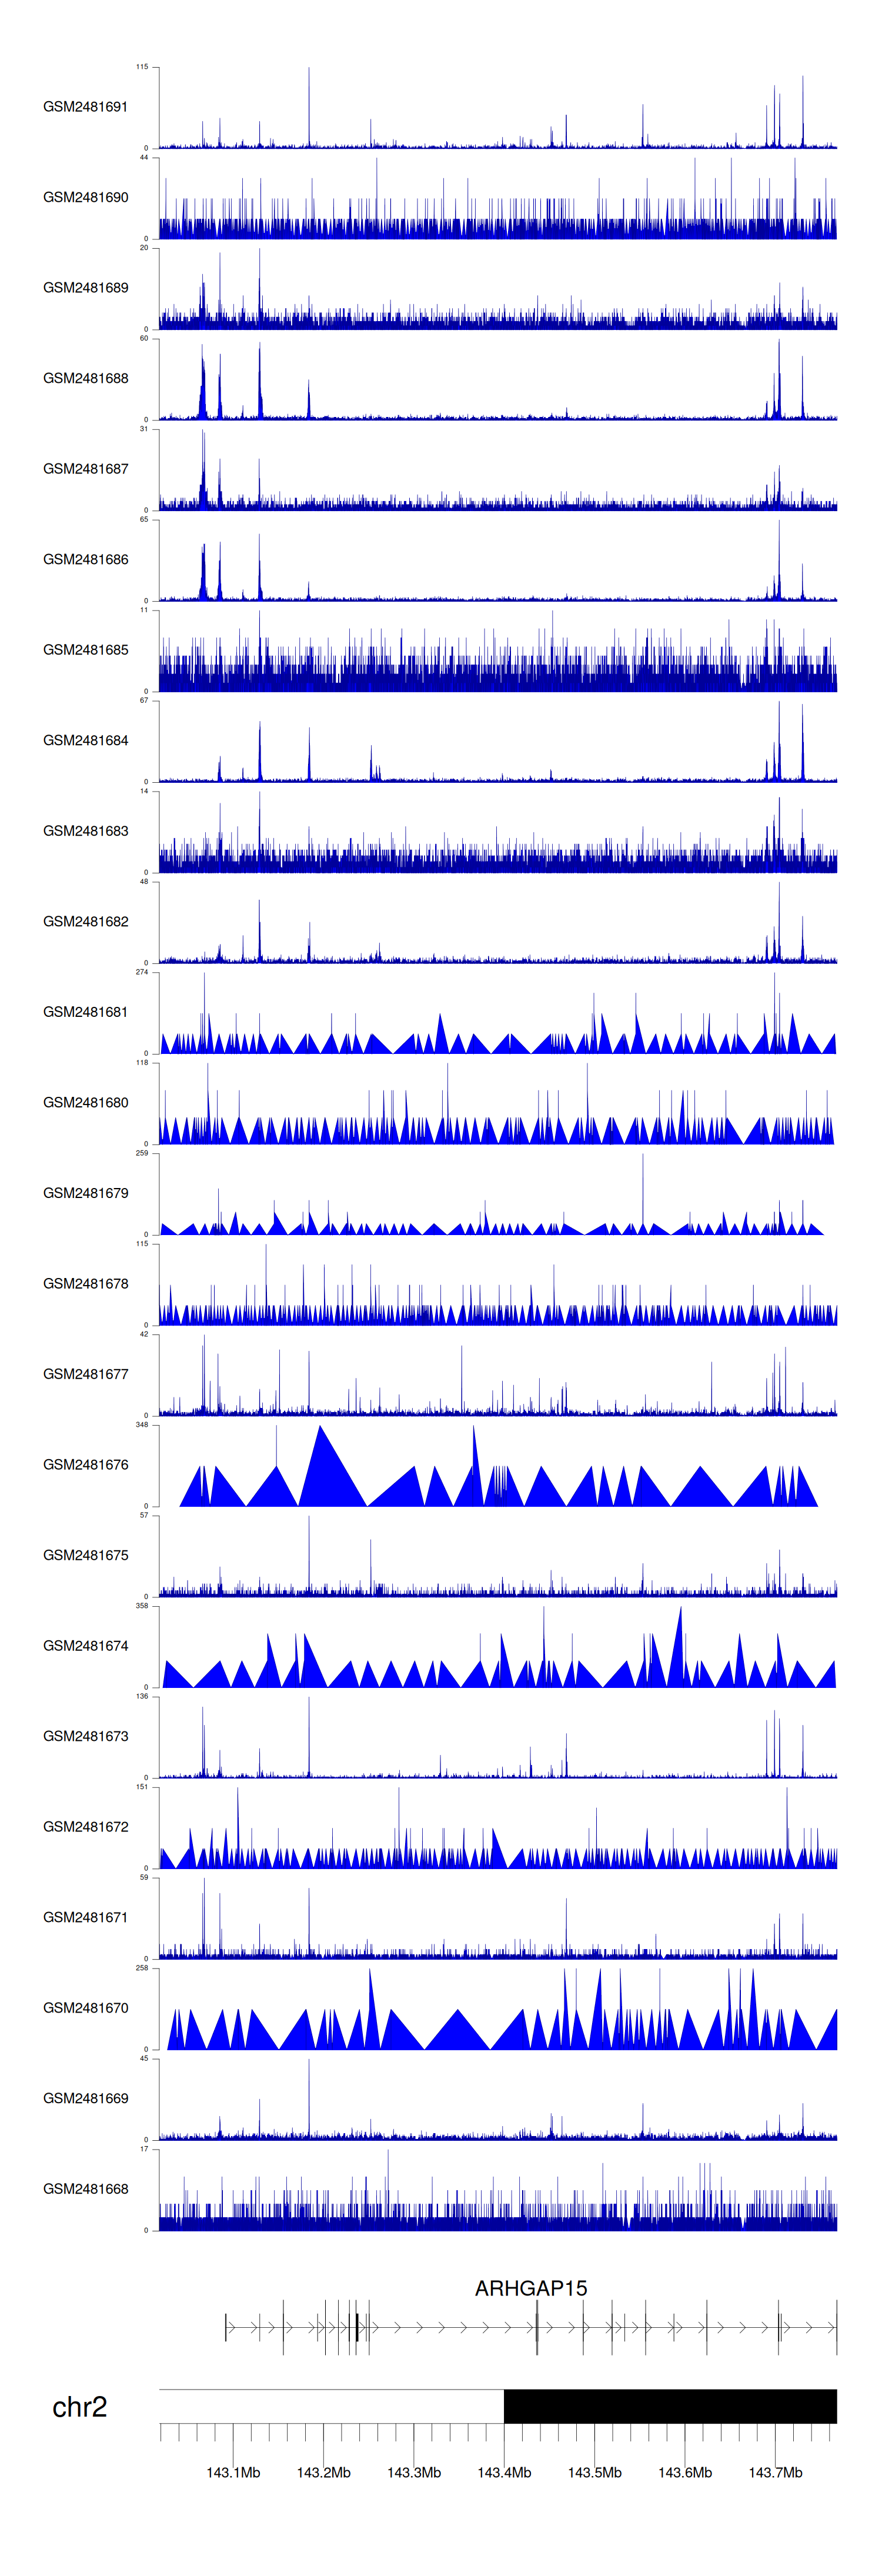
C GSE94732
|
Chip-seq |
24 |
Illumina NextSeq 500 (Homo sapiens);illumina Genome Analyzer IIx (Homo sapiens) |
|
GSE52244
|
Expression array |
15 |
[HuEx-1_0-st] Affymetrix Human Exon 1.0 ST Array [probe set (exon) version] |
|
GSE19080
|
Expression array |
38 |
Homo sapiens 3K Immunoarray2 HTLV-1 JH |
|
GSE10789
|
Expression array |
6 |
NCI/ATC Hs-OperonV3 |
|
GSE224047
|
RNA-seq |
10 |
Illumina NextSeq 500 (Homo sapiens) |
|
GSE168557
|
Expression array |
6 |
Agilent-039494 SurePrint G3 Human GE v2 8x60K Microarray 039381 (Feature Number version) |
|
GSE136189
|
Methylation profiling (Array) |
40 |
Illumina HumanMethylation450 BeadChip (HumanMethylation450_15017482);Illumina Infinium HumanMethylation850 BeadChip |
When the gene can detect a peak in the dataset, a peak plot will be displayed.
> Dataset: GSE94732 - ARHGAP15 peak across samples
|
Peak Plot
|
|
|
