Gene Information
|
Gene Name
|
ATXN2 |
|
Gene ID
|
6311
|
|
Gene Full Name
|
ataxin 2 |
|
Gene Alias
|
ATX2|SCA2|TNRC13 |
|
Transcripts
|
ENSG00000204842
|
|
Virus
|
HTLV1 |
|
Gene Type
|
protein-coding |
|
HPA Location Info
|
Cytosol; 
|
|
Membrane Info
|
Disease related genes, Human disease related genes, Predicted intracellular proteins |
|
Uniport_ID
|
Q99700
|
|
HGNC ID
|
HGNC:10555
|
|
OMIM ID
|
601517 |
|
Summary
|
This gene belongs to a group of genes that is associated with microsatellite-expansion diseases, a class of neurological and neuromuscular disorders caused by expansion of short stretches of repetitive DNA. The protein encoded by this gene has two globular domains near the N-terminus, one of which contains a clathrin-mediated trans-Golgi signal and an endoplasmic reticulum exit signal. The encoded cytoplasmic protein localizes to the endoplasmic reticulum and plasma membrane, is involved in endocytosis, and modulates mTOR signals, modifying ribosomal translation and mitochondrial function. The N-terminal region of the protein contains a polyglutamine tract of 14-31 residues that can be expanded in the pathogenic state to 32-200 residues. Intermediate length expansions of this tract increase susceptibility to amyotrophic lateral sclerosis, while long expansions of this tract result in spinocerebellar ataxia-2, an autosomal-dominantly inherited, neurodegenerative disorder. Genome-wide association studies indicate that loss-of-function mutations in this gene may be associated with susceptibility to type I diabetes, obesity and hypertension. Alternative splicing results in multiple transcript variants. [provided by RefSeq, Nov 2016] |
Target gene [ATXN2] related to VISs 
Integration Table: if previous studies reported that target gene was altered by virus integration events, the overlap between VISs in this literature and Cistrome factors was listed in this section
| DVID |
Chromosome |
HM |
TFBS |
CA |
Sum of Overlapped Records |
Detail |
| 6029596 |
chr12 |
1 |
0 |
0 |
1 |
View |
Target gene [ATXN2] related to Omics data
| Data ID |
Experiment type |
Sample number |
Platform |
|
GSE189602
|
Methylation profiling (Array) |
4 |
Infinium MethylationEPIC |
|
C GSE94732
|
Chip-seq |
24 |
Illumina NextSeq 500 (Homo sapiens);illumina Genome Analyzer IIx (Homo sapiens) |
|
GSE52244
|
Expression array |
15 |
[HuEx-1_0-st] Affymetrix Human Exon 1.0 ST Array [probe set (exon) version] |
|
GSE19080
|
Expression array |
38 |
Homo sapiens 3K Immunoarray2 HTLV-1 JH |
|
GSE10789
|
Expression array |
6 |
NCI/ATC Hs-OperonV3 |
|
GSE224047
|
RNA-seq |
10 |
Illumina NextSeq 500 (Homo sapiens) |
|
GSE168557
|
Expression array |
6 |
Agilent-039494 SurePrint G3 Human GE v2 8x60K Microarray 039381 (Feature Number version) |
|
GSE136189
|
Methylation profiling (Array) |
40 |
Illumina HumanMethylation450 BeadChip (HumanMethylation450_15017482);Illumina Infinium HumanMethylation850 BeadChip |
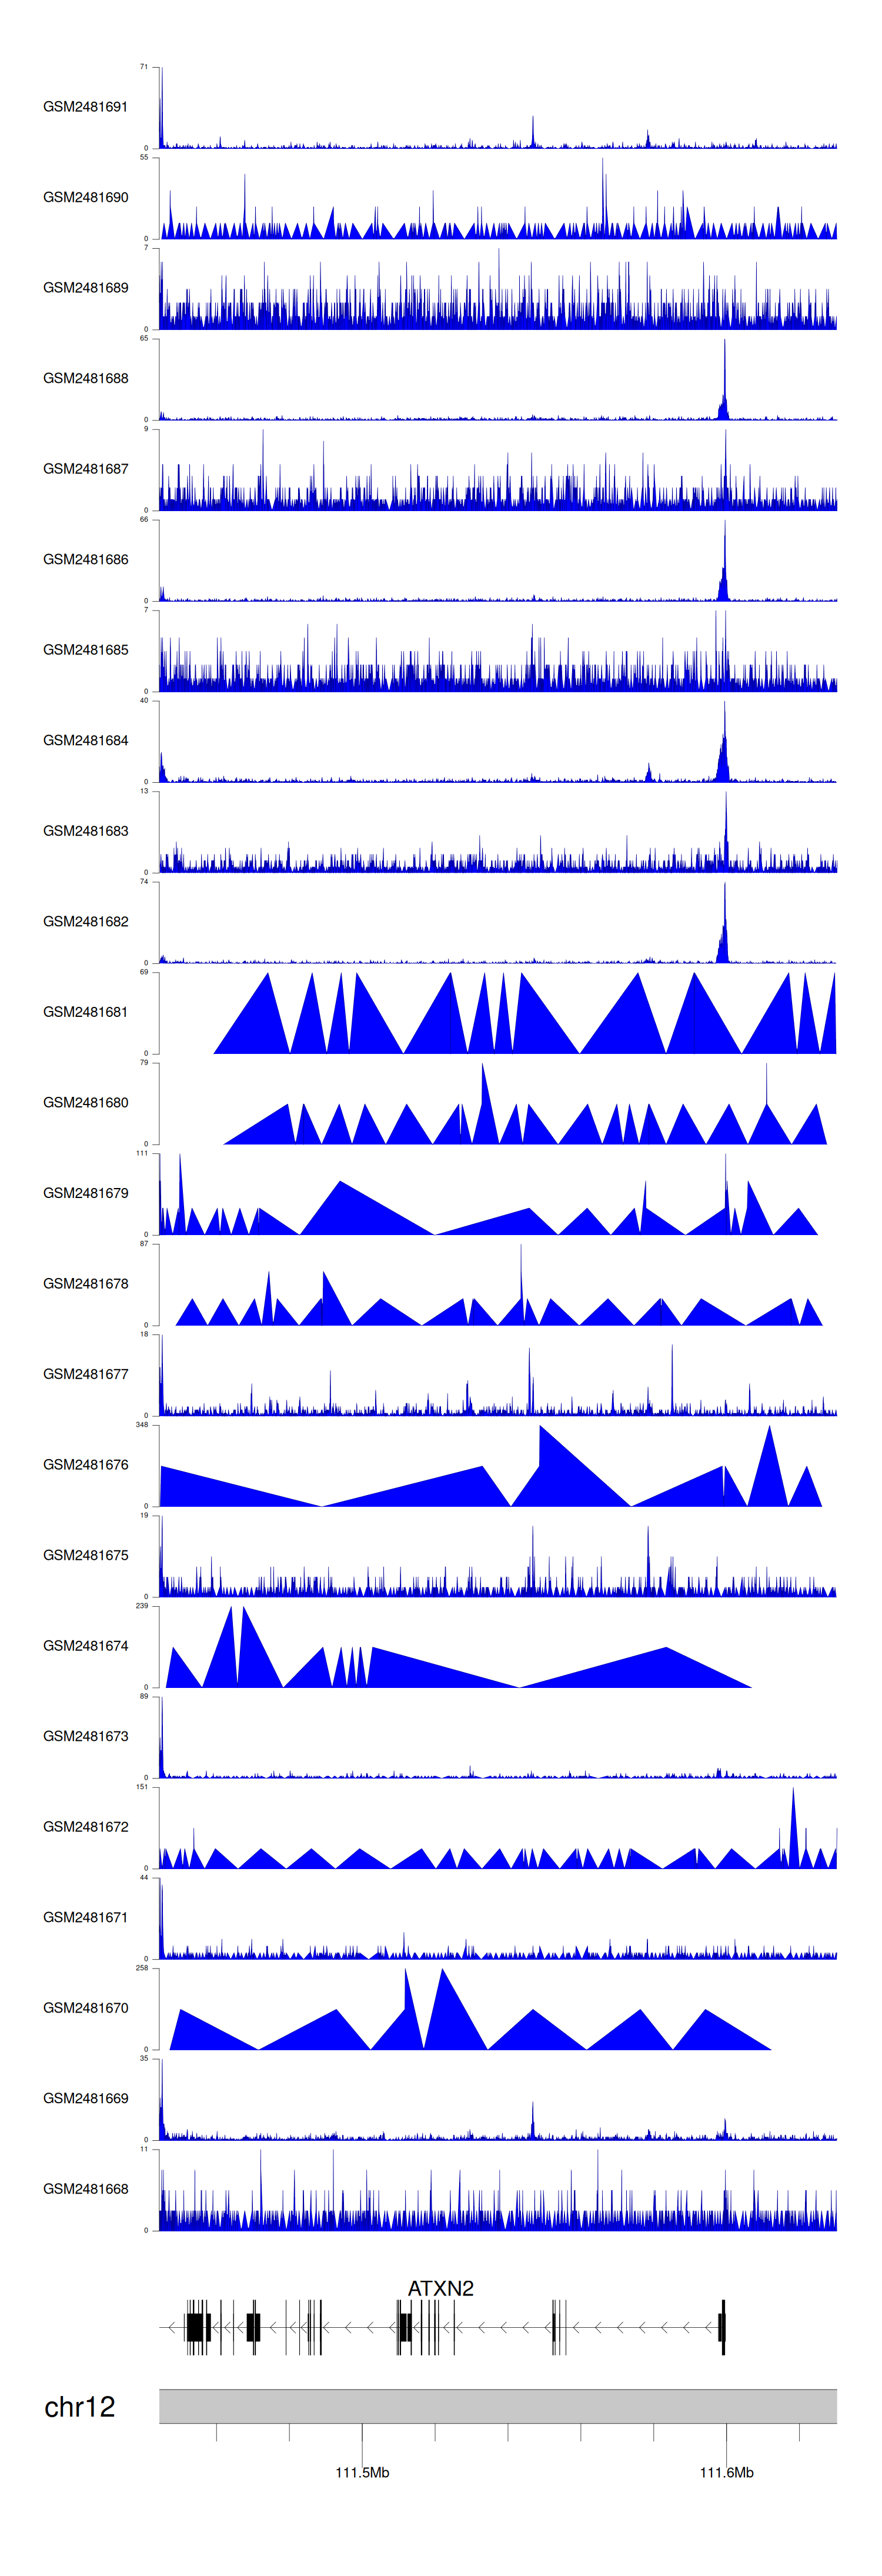
When the gene can detect a peak in the dataset, a peak plot will be displayed.
> Dataset: GSE94732 - ATXN2 peak across samples
|
Peak Plot
|
|
|
