Gene Information
|
Gene Name
|
BCAT2 |
|
Gene ID
|
587
|
|
Gene Full Name
|
branched chain amino acid transaminase 2 |
|
Gene Alias
|
BCAM|BCATM|BCT2|HVLI|PP18 |
|
Transcripts
|
ENSG00000105552
|
|
Virus
|
HTLV1 |
|
Gene Type
|
protein-coding |
|
HPA Location Info
|
Nucleoplasm, Mitochondria; 
|
|
Membrane Info
|
Disease related genes, Enzymes, Human disease related genes, Metabolic proteins, Potential drug targets, Predicted intracellular proteins |
|
Uniport_ID
|
O15382
|
|
HGNC ID
|
HGNC:977
|
|
OMIM ID
|
113530 |
|
Summary
|
This gene encodes a branched chain aminotransferase found in mitochondria. The encoded protein forms a dimer that catalyzes the first step in the production of the branched chain amino acids leucine, isoleucine, and valine. Multiple transcript variants encoding different isoforms have been found for this gene. [provided by RefSeq, Sep 2009] |
Target gene [BCAT2] related to VISs 
Integration Table: if previous studies reported that target gene was altered by virus integration events, the overlap between VISs in this literature and Cistrome factors was listed in this section
| DVID |
Chromosome |
HM |
TFBS |
CA |
Sum of Overlapped Records |
Detail |
| 6000424 |
chr19 |
1639 |
20 |
0 |
1659 |
View |
Target gene [BCAT2] related to Omics data
| Data ID |
Experiment type |
Sample number |
Platform |
|
GSE189602
|
Methylation profiling (Array) |
4 |
Infinium MethylationEPIC |
|
C GSE94732
|
Chip-seq |
24 |
Illumina NextSeq 500 (Homo sapiens);illumina Genome Analyzer IIx (Homo sapiens) |
|
GSE52244
|
Expression array |
15 |
[HuEx-1_0-st] Affymetrix Human Exon 1.0 ST Array [probe set (exon) version] |
|
GSE19080
|
Expression array |
38 |
Homo sapiens 3K Immunoarray2 HTLV-1 JH |
|
GSE10789
|
Expression array |
6 |
NCI/ATC Hs-OperonV3 |
|
GSE224047
|
RNA-seq |
10 |
Illumina NextSeq 500 (Homo sapiens) |
|
GSE168557
|
Expression array |
6 |
Agilent-039494 SurePrint G3 Human GE v2 8x60K Microarray 039381 (Feature Number version) |
|
GSE136189
|
Methylation profiling (Array) |
40 |
Illumina HumanMethylation450 BeadChip (HumanMethylation450_15017482);Illumina Infinium HumanMethylation850 BeadChip |
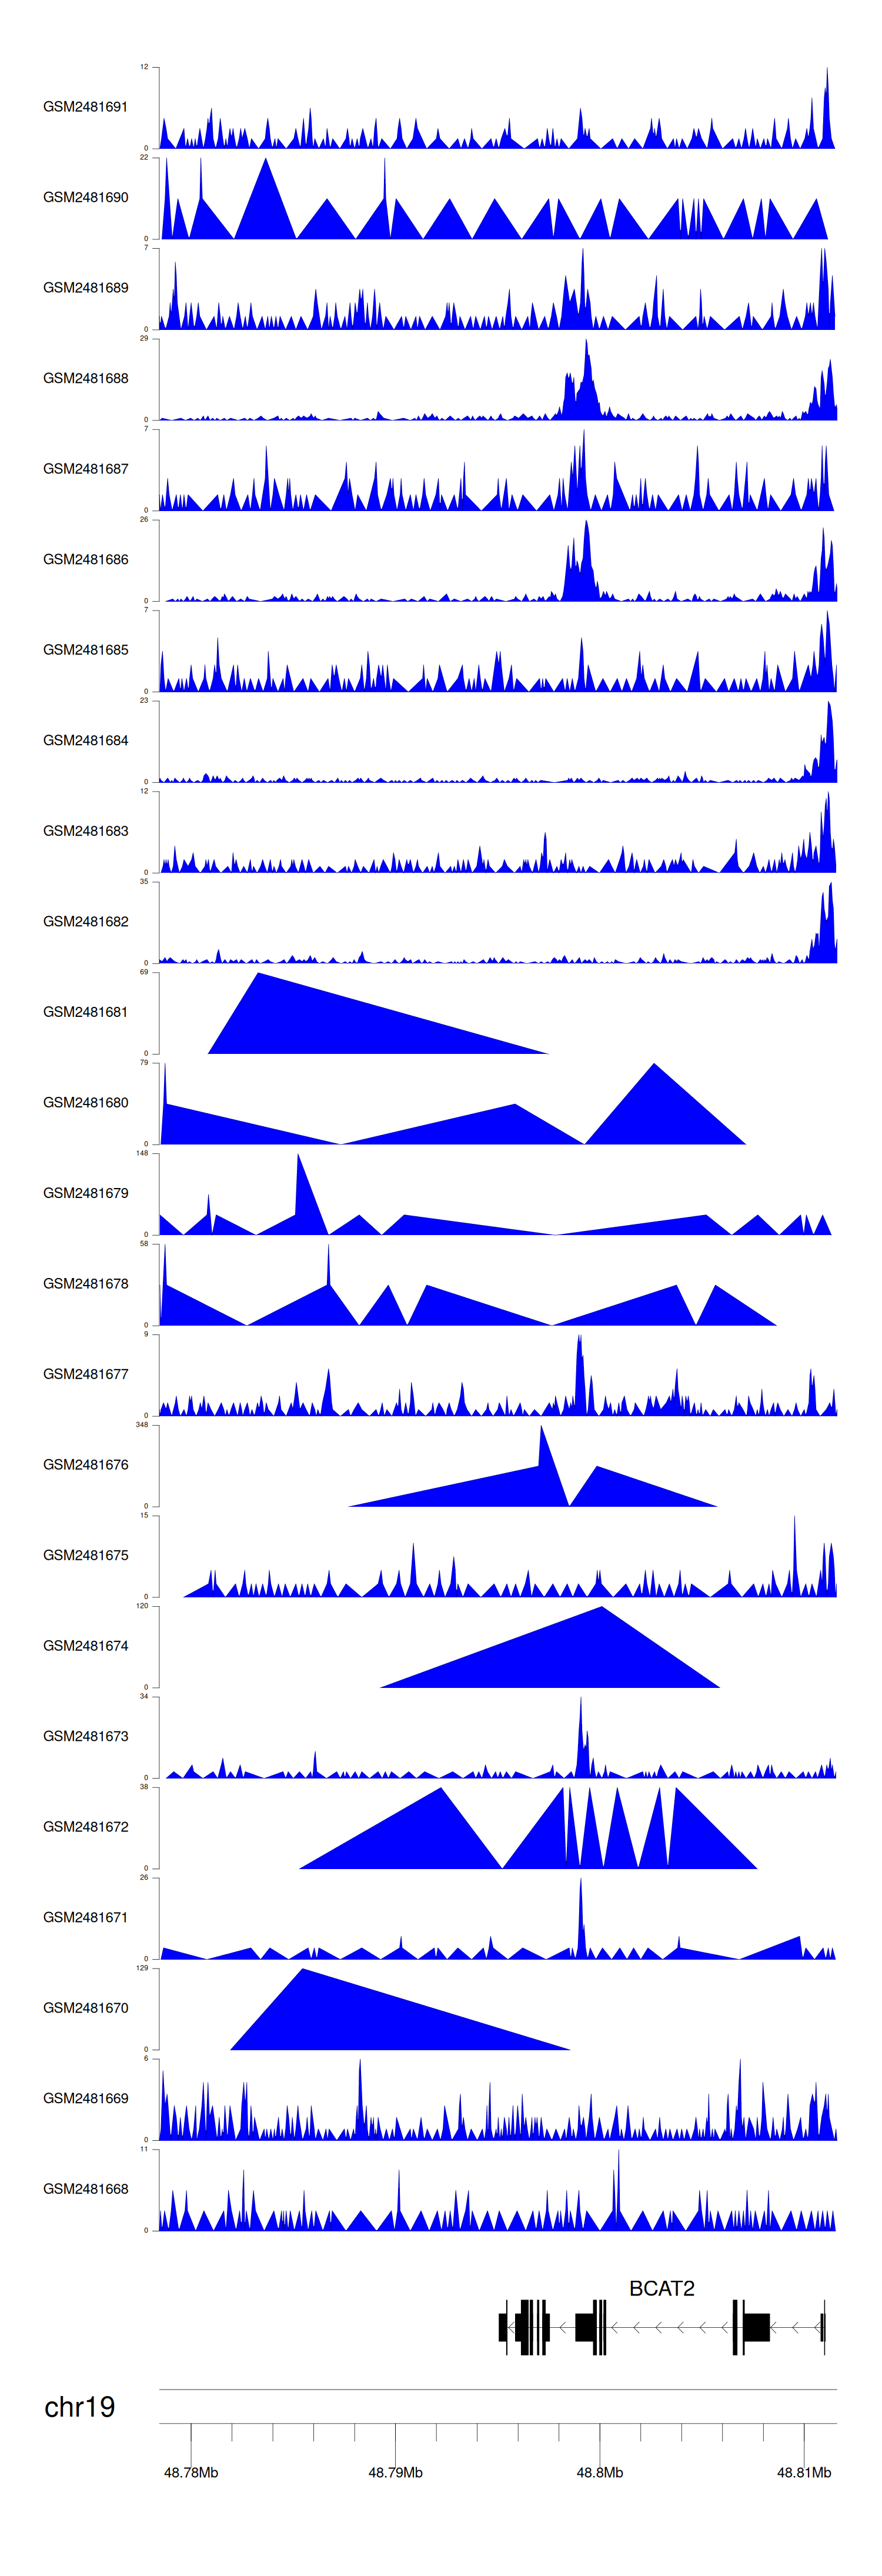
When the gene can detect a peak in the dataset, a peak plot will be displayed.
> Dataset: GSE94732 - BCAT2 peak across samples
|
Peak Plot
|
|
|
