Gene Information
|
Gene Name
|
CASP10 |
|
Gene ID
|
843
|
|
Gene Full Name
|
caspase 10 |
|
Gene Alias
|
ALPS2|FLICE-2|FLICE2|MCH4 |
|
Transcripts
|
ENSG00000003400
|
|
Virus
|
HBV |
|
Gene Type
|
protein-coding |
|
HPA Location Info
|
Golgi apparatus;Vesicles; 
|
|
Membrane Info
|
Cancer-related genes, Disease related genes, Enzymes, Human disease related genes, Potential drug targets, Predicted intracellular proteins |
|
Uniport_ID
|
Q92851
|
|
HGNC ID
|
HGNC:1500
|
|
OMIM ID
|
601762 |
|
Summary
|
This gene encodes a protein which is a member of the cysteine-aspartic acid protease (caspase) family. Sequential activation of caspases plays a central role in the execution-phase of cell apoptosis. Caspases exist as inactive proenzymes which undergo proteolytic processing at conserved aspartic residues to produce two subunits, large and small, that dimerize to form the active enzyme. This protein cleaves and activates caspases 3 and 7, and the protein itself is processed by caspase 8. Mutations in this gene are associated with type IIA autoimmune lymphoproliferative syndrome, non-Hodgkin lymphoma and gastric cancer. Alternatively spliced transcript variants encoding different isoforms have been described for this gene. [provided by RefSeq, Apr 2011] |
Target gene [CASP10] related to VISs 
Integration Table: if previous studies reported that target gene was altered by virus integration events, the overlap between VISs in this literature and Cistrome factors was listed in this section
| DVID |
Chromosome |
HM |
TFBS |
CA |
Sum of Overlapped Records |
Detail |
| 1001824 |
chr2 |
354 |
72 |
39 |
465 |
View |
| 1020722 |
chr2 |
354 |
72 |
39 |
465 |
View |
Target gene [CASP10] related to Omics data
| Data ID |
Experiment type |
Sample number |
Platform |
|
GSE252863
|
scRNA-seq |
10 |
Illumina HiSeq 2500 (Homo sapiens) |
|
GSE236281
|
RNA-seq |
12 |
Illumina MiSeq (Homo sapiens) |
|
C GSE35465
|
Chip-seq;RNA-seq |
6 |
Illumina HiSeq 2000 (Homo sapiens) |
|
C GSE68402
|
Chip-seq |
26 |
Illumina MiSeq (Homo sapiens);Illumina HiSeq 2500 (Homo sapiens) |
|
GSE247322
|
scRNA-seq |
27 |
Illumina NovaSeq 6000 (Homo sapiens) |
|
TCGA_LIHC_HBV
|
DNA methylation sequencing;RNA-seq |
97 |
TCGA |
|
C GSE270130
|
Chip-seq |
27 |
Illumina NovaSeq 6000 (Homo sapiens) |
|
GSE224901
|
RNA-seq |
21 |
Illumina NovaSeq 6000 (Homo sapiens) |
|
C GSE100400
|
Chip-seq;RNA-seq;4C_cccDNA |
31 |
Illumina NextSeq 500 (Homo sapiens);Illumina NextSeq 500 (Mus musculus) |
|
GSE173897
|
RNA-seq |
95 |
Illumina HiSeq 4000 (Homo sapiens) |
|
GSE262515
|
RNA-seq |
21 |
Illumina HiSeq 2500 (Homo sapiens);Illumina HiSeq 2500 (Mus musculus) |
|
GSE110345
|
RNA-seq |
4 |
Illumina HiSeq 2500 (Homo sapiens) |
|
C GSE131257
|
ATAC-seq;RNA-seq |
19 |
Illumina HiSeq 2500 (Homo sapiens) |
|
GSE94660
|
RNA-seq |
42 |
Illumina HiSeq 2500 (Homo sapiens) |
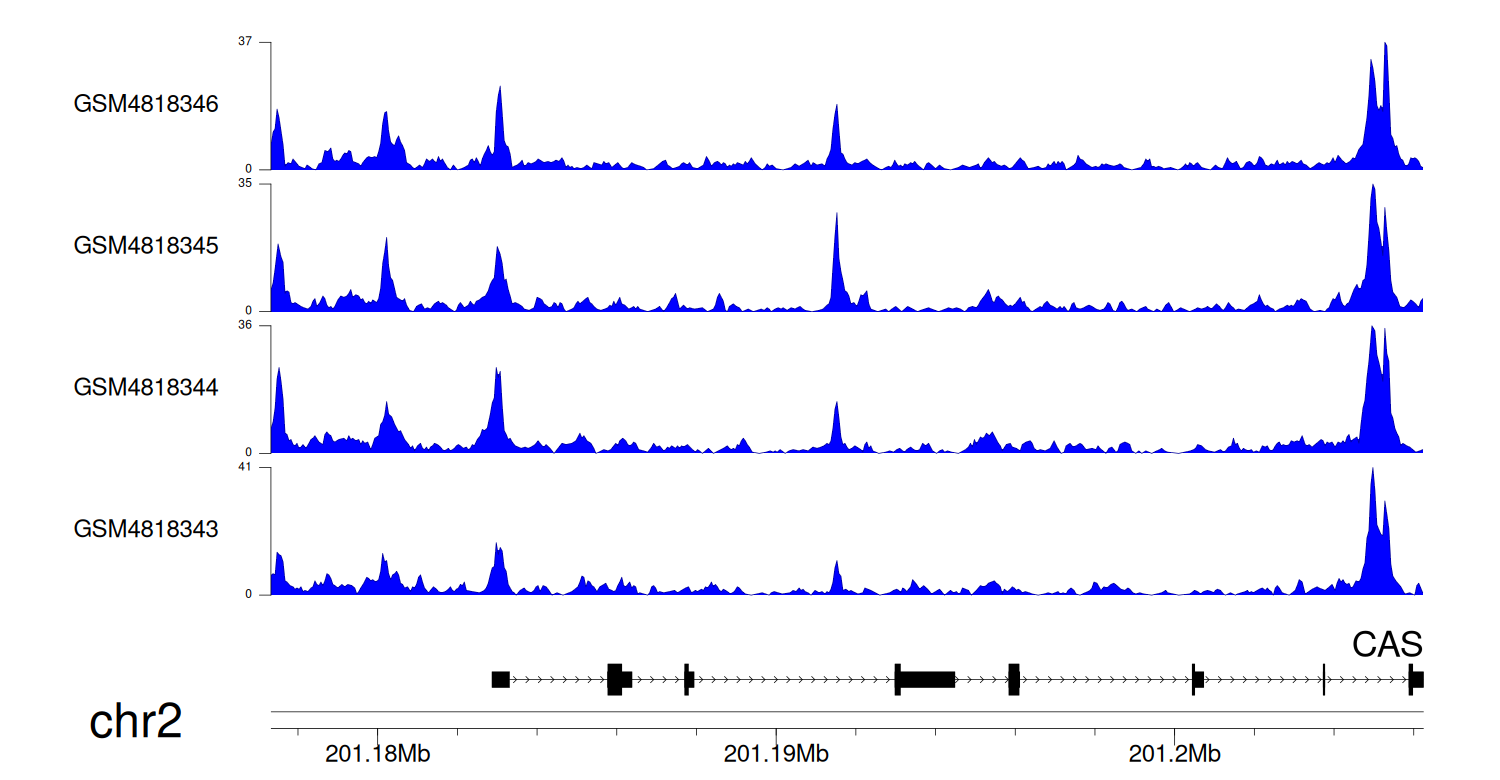
When the gene can detect a peak in the dataset, a peak plot will be displayed.
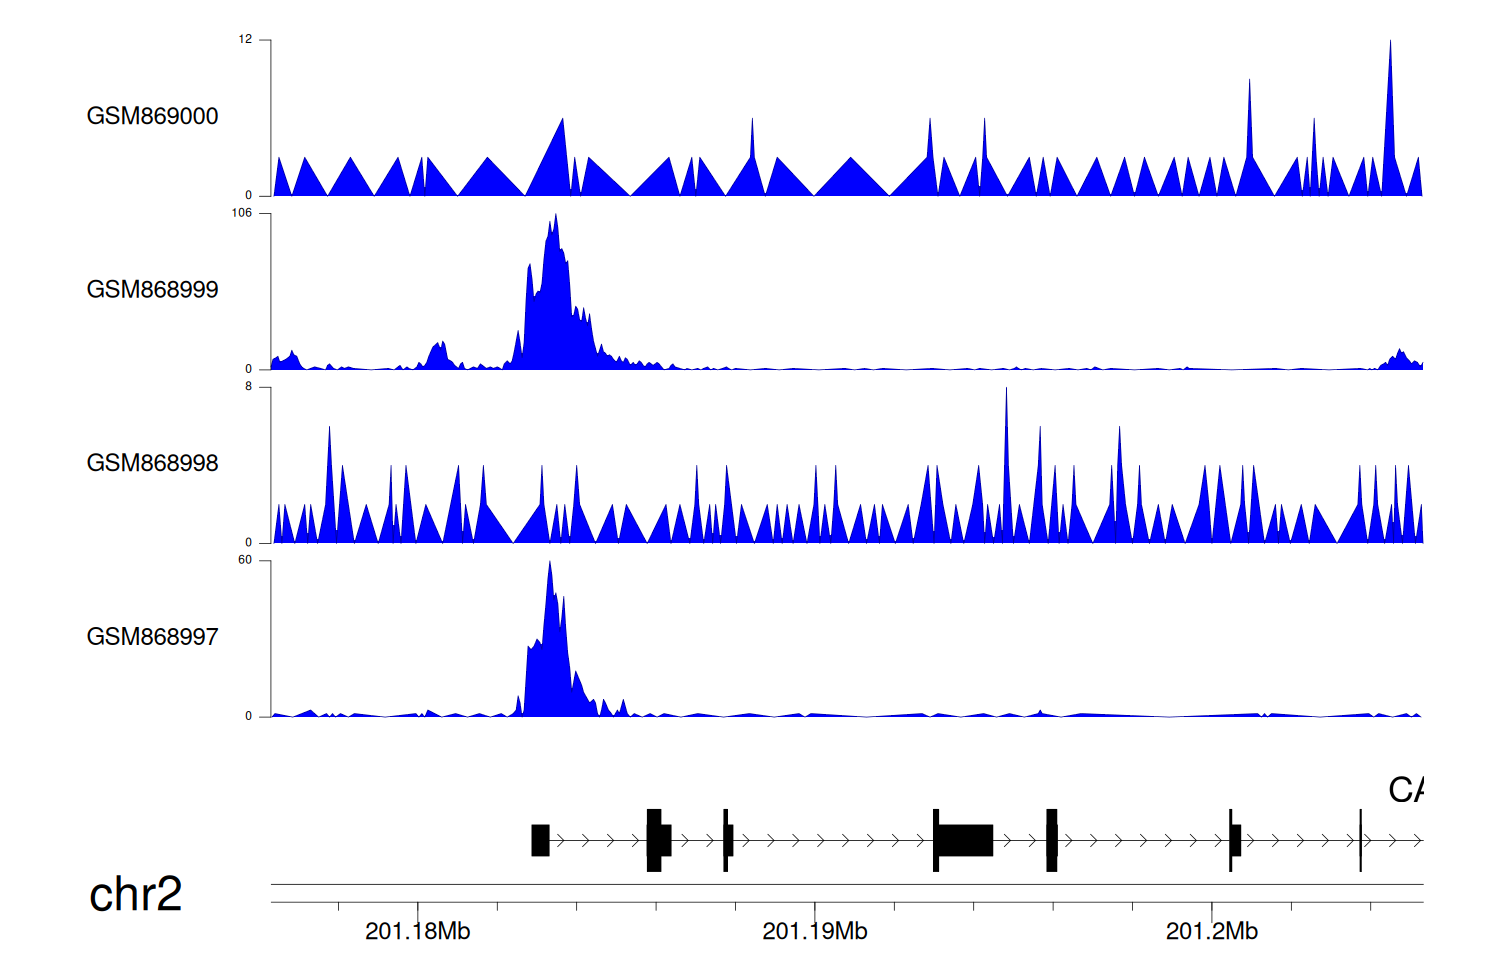
> Dataset: GSE35465 - CASP10 peak across samples
|
Peak Plot
|
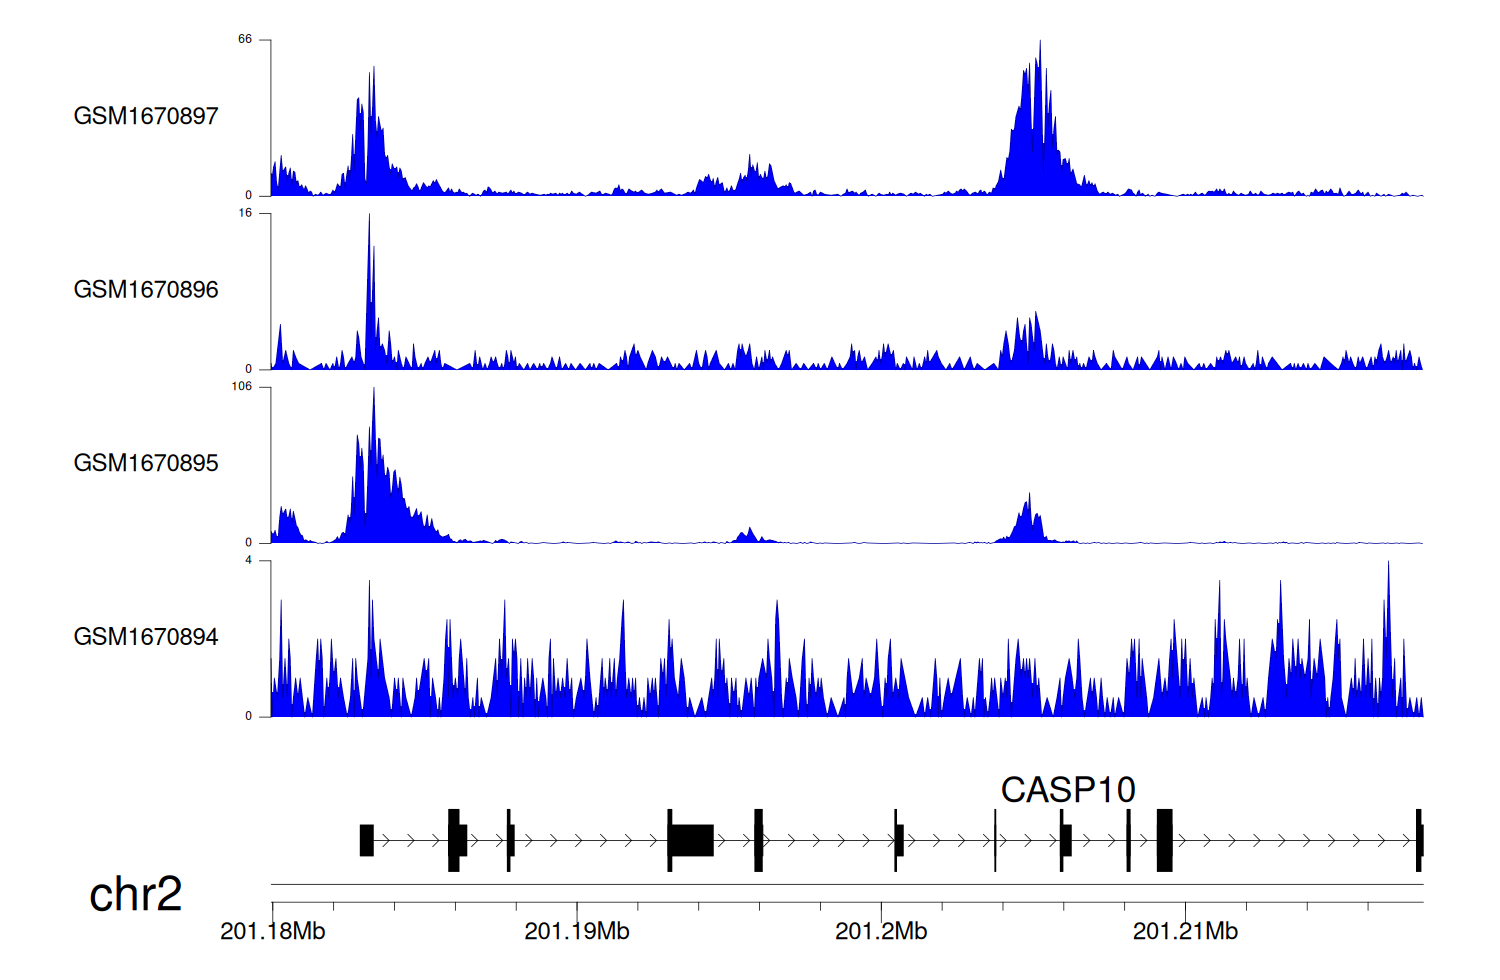
> Dataset: GSE68402 - CASP10 peak across samples
|
Peak Plot
|
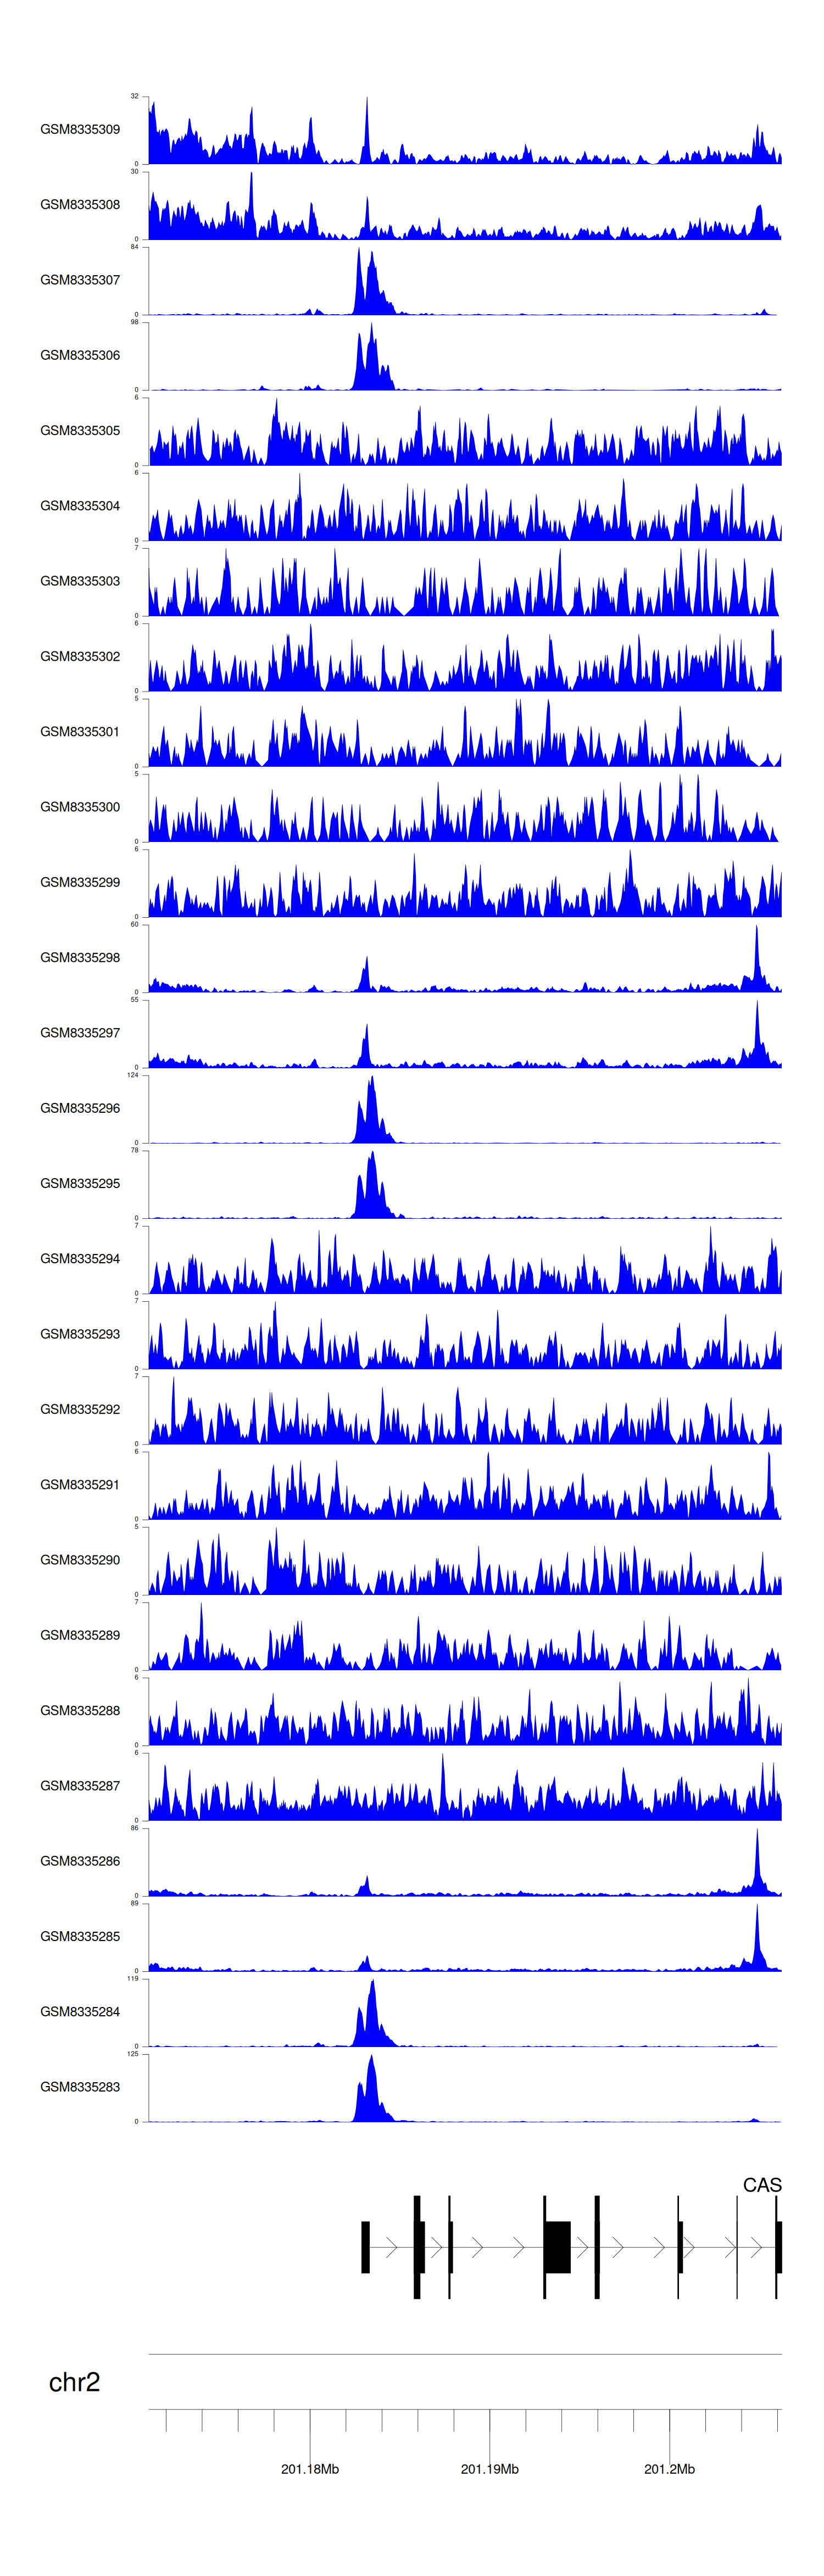
> Dataset: GSE270130 - CASP10 peak across samples
|
Peak Plot
|
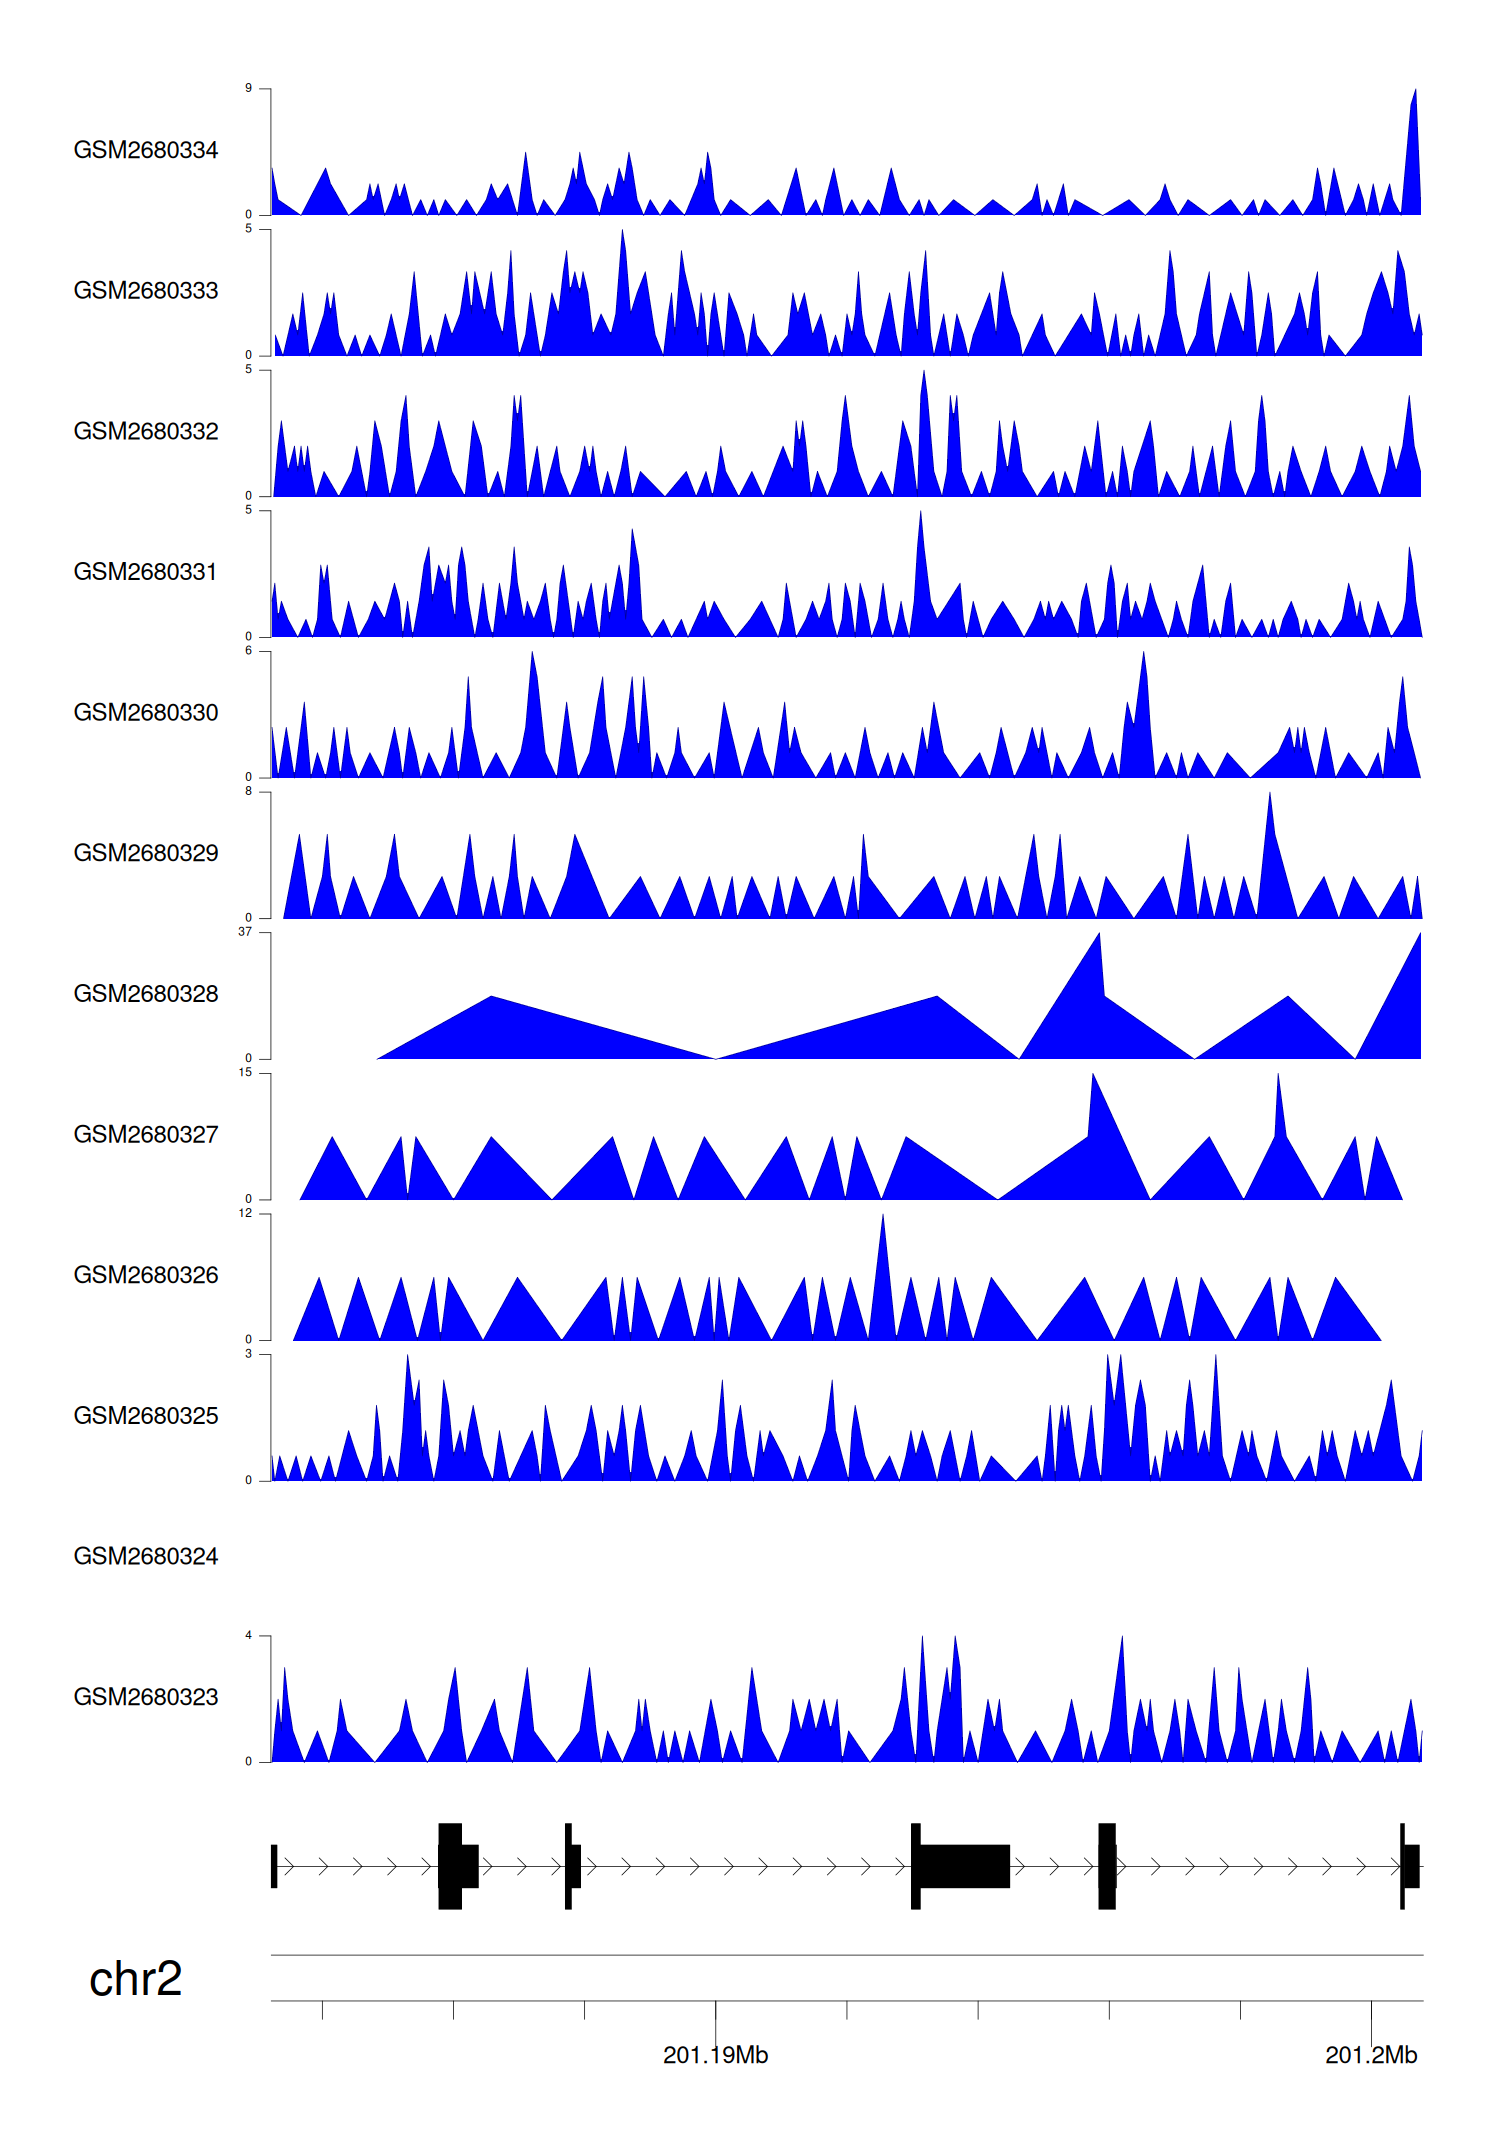
> Dataset: GSE100400 - CASP10 peak across samples
|
Peak Plot
|
> Dataset: GSE131257 - CASP10 peak across samples
|
Peak Plot
|
|
|
